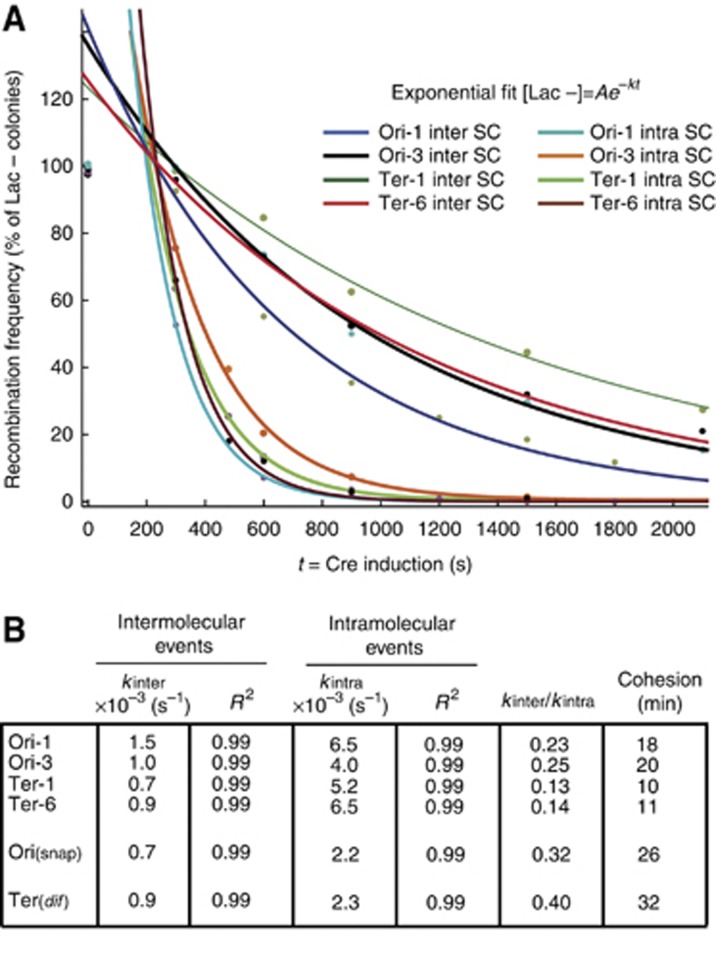
Figure 3.
Sister chromatid interaction varied according to the locus considered. (A) Cre recombination follows single exponential decay kinetics for the inter and the intramolecular recombination reactions. The data from Figure 2B were plotted according to the disappearing of Lac− colonies versus the length of the induction. Single exponential fits are represented. To avoid taking into consideration the lag observed during the first 5 min, the fits exclude the time 0 and 2.5 min of induction. (B) Kinetic constants, kinter and kintra were presented for every reaction. The estimation of the Cohesion Period was given by CP=τ × (kinter/kintra), where τ is the generation time (80 min).

