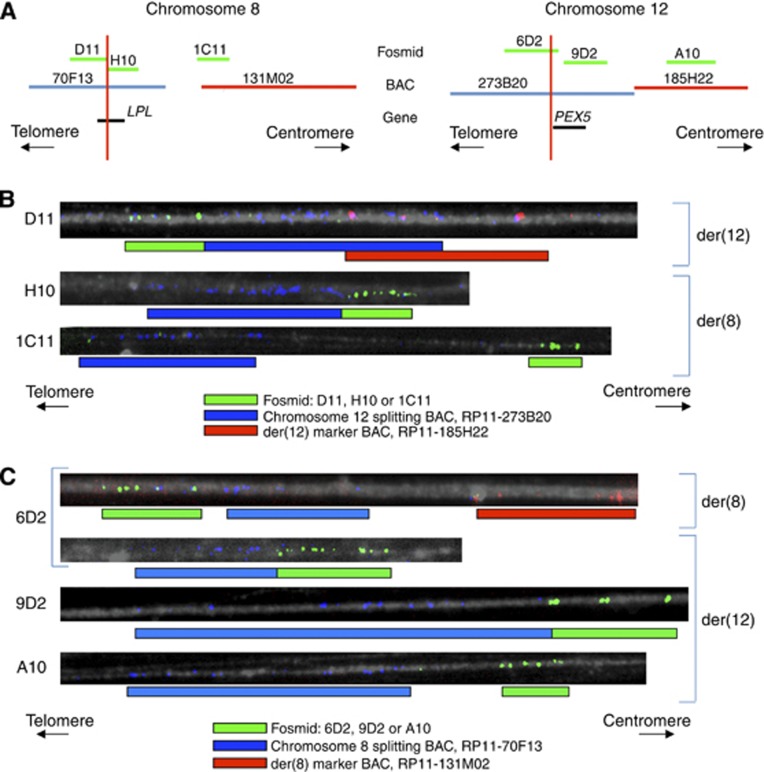
Figure 2.
Breakpoint mapping by fosmid fibre FISH. (A) The fosmid probes (labelled green) selected for hybridisation to MS751 chromosome fibres either tiled the genes of interest on chromosome 8 and 12 (LPL and PEX5) or were located centromeric to the breakpoint region, and therefore acted as a control. The fosmids were co-hybridised with BAC probes that mapped to the breakpoint of the reciprocal chromosome (labelled blue) or centromeric to it (labelled red). (B) Of the chromosome 8 fosmids, D11 hybridised to der(12) (co-localisation of green signals with both blue and red signals), whereas H10 and 1C11 hybridised to der(8) (co-localisation of green signals with only blue signals). (C) Of the chromosome 12 fosmids, 6D2 split between der(8) and der(12) (co-localisation of green signals with both blue and red signals on some fibres, and with blue signals alone on other fibres), whereas 9D2 and A10 hybridised to der(12) (co-localisation of green signals with only blue signals). The suspected breakpoint regions on each chromosome determined by fosmid fibre FISH are shown in panel (A) (red vertical lines).

