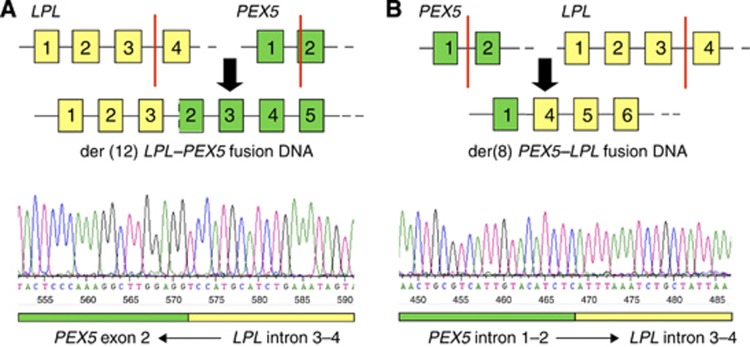
Figure 3.
Schematic of breakpoints resulting in LPL-PEX5 and PEX5-LPL fusion genes. Numbered boxes represent exons of LPL (yellow) and PEX5 (green), with red vertical lines indicating the positions of the breakpoints resulting in the LPL-PEX5 (A) and PEX5-LPL (B) fusion genes. The lower panels show the sequencing traces for each breakpoint; a reverse read in (A) and a forward read in (B).

