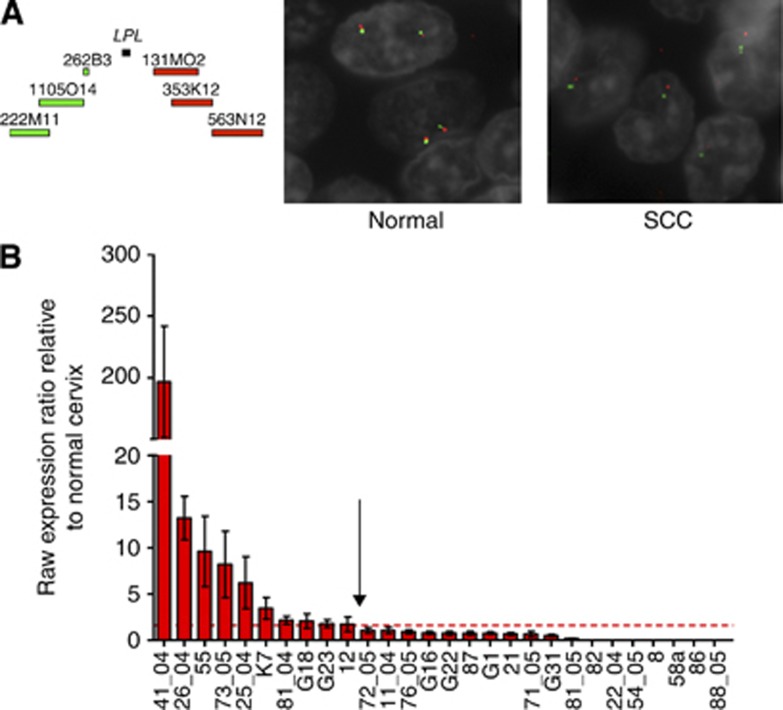
Figure 5.
LPL status in cervical SCC. (A) For TMA FISH, the probes were three tiling BACs 5′ of LPL and three tiling BACs 3′ of LPL, which were labelled in green and red, respectively (left panel). The DNA counterstain (4′,6-diamidino-2-phenylindole) is shown in grey. Co-localisation of probes was seen in normal cervix samples (middle panel) and 150/151 primary cervical SCC samples. One cervical SCC sample showed probe separation (right panel), indicating rearrangement of the LPL gene. Interestingly, this case also showed deletion of the wild-type LPL allele. (B) Quantitative RT–PCR to measure levels of full-length LPL was performed on 28 cervical SCC samples and 5 normal cervical squamous epithelium samples, relative to Universal Reference cDNA. Error bars indicate the s.e.m. for LPL expression levels, normalised to four different housekeeping genes. The dashed line shows 3 standard deviations above the mean of the five normal samples. Ten tissue samples (left of arrow) showed a significantly higher level of LPL expression than normal cervix.

