Figure 1.
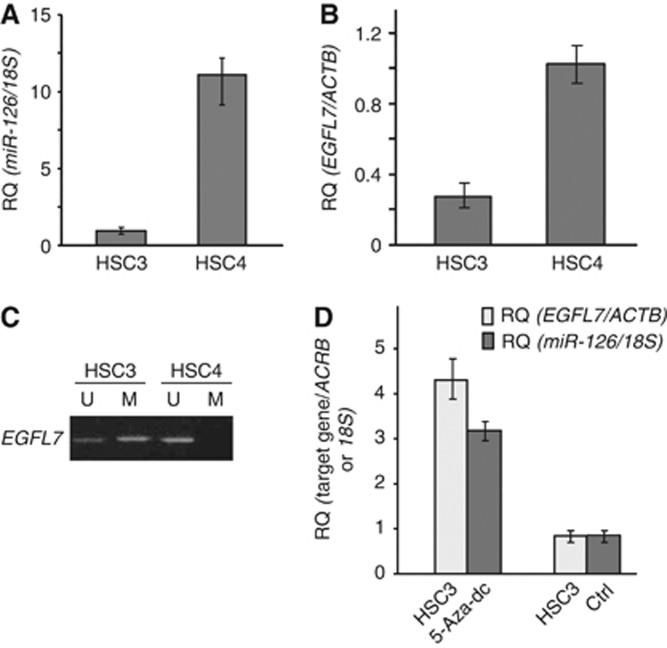
Expression levels of miR-126 (A) and EGFL7 (B) measured using qRT–PCR in the OSCC cells. The 18S or beta-actin (ACTB) transcript levels were used as internal controls for miR-126 and EGFL7 expressions, respectively. The methylation status of EGFL7 by MSP in the OSCC cells is shown in (C). The changes of the miR-126 and EGFL7 expressions in the 5-Aza-dc-treated HSC3 cells are shown in (D). The expression levels of miR-126 and EGFL7 in the untreated HSC3 cells were set to 1.

