Figure 5.
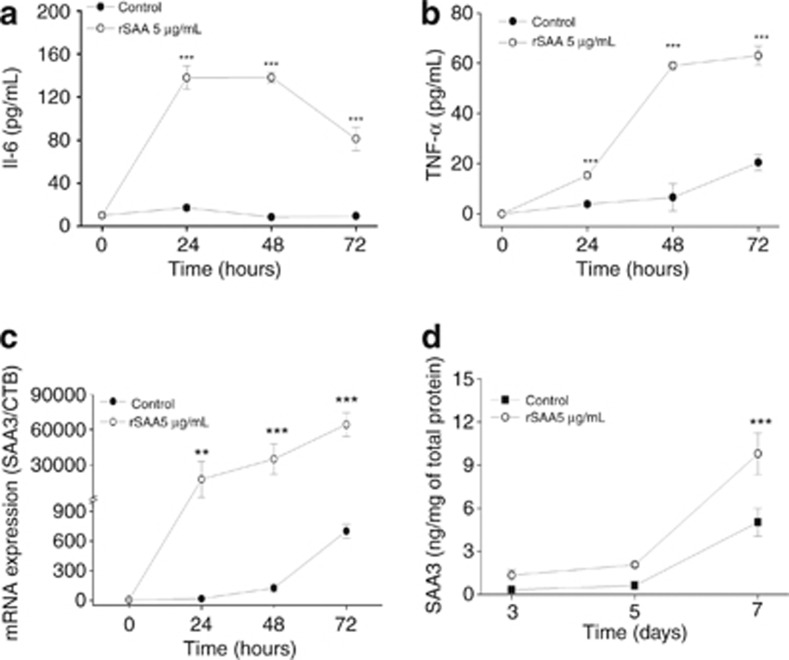
Cytokine release and SAA3 production during the course of differentiation. Using an ELISA assay, (a) interleukin 6 (IL-6) and (b) TNF-α release were assessed using the supernatant of cultured 3T3-L1 cells that underwent differentiation in the absence (•) or presence (○) of rSAA (5 μg ml−1). (c) The effect of rSAA on the expression of SAA3 in cells treated with hormonal induction (▪) or with rSAA (5 μg ml−1) and hormonal induction (○). (d) SAA3 protein production assessed by ELISA assay in the absence (•) or presence (○) of rSAA (5 μg/ml). Data are the mean±s.e. of three independent experiments and two-way analysis of variance was performed (**P<0.01, ***P<0.001 vs control).

