Figure 5.
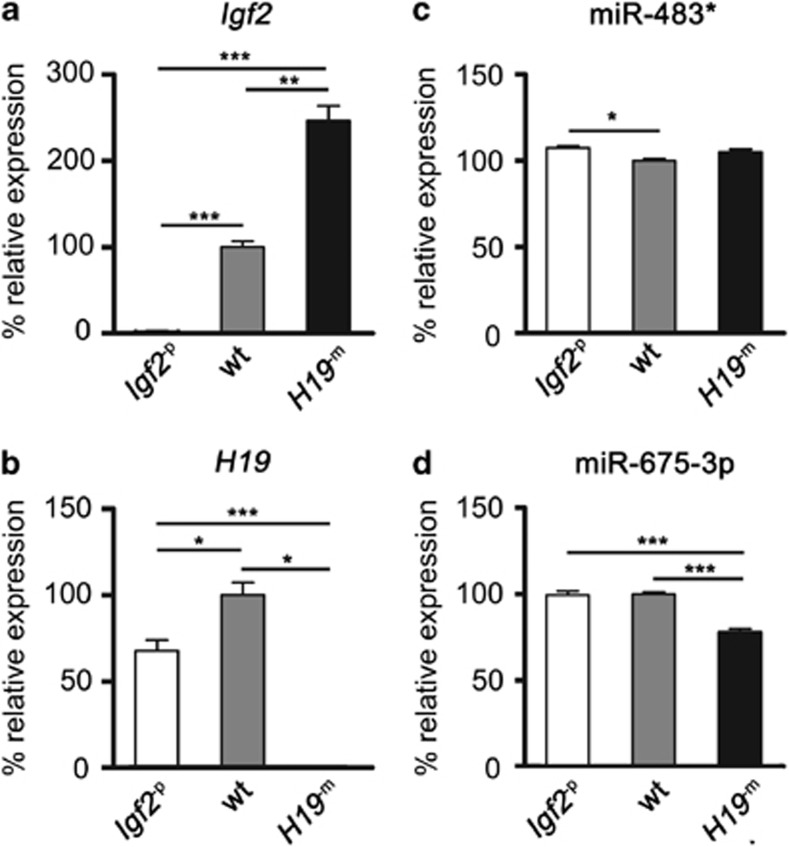
Perturbation of miR-483* and miR-675-3p associate with Igf2 and H19/DMR deletions. Quantification of (a) Igf2, (b) H19, (c) miR-483* and (d) miR-675-3p expression in E9.5 embryos by RT–qPCR (a, b) and Illumina array (c, d). Results are shown as percentage of wt levels. Error bars represent ±s.e.m. of 14–28 biological replicates per group. *, ** and *** indicate P<0.05, <0.01 and <0.001, respectively.

