Figure 5.

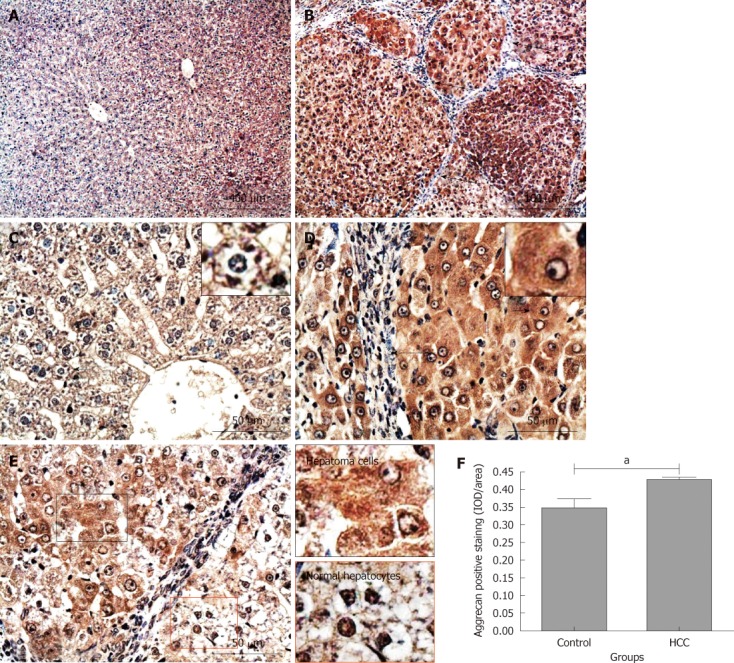
Immunochemical staining for aggrecan in rat liver tissues. Aggrecan positive staining was dark red. A and C: Control group; B, D and E: Hepatocellular carcinoma (HCC) model group. Long black arrows: Fibrous tissue septa; short black arrows: The cells are magnified in the small boxes; E: Areas in black and red boxes are magnified in left column; F: Comparison of the average integrated optical density (IOD) in aggrecan positive staining in liver tissues between the control and HCC model groups (a P < 0.05). IOD/area: Integrated optical density per stained area.
