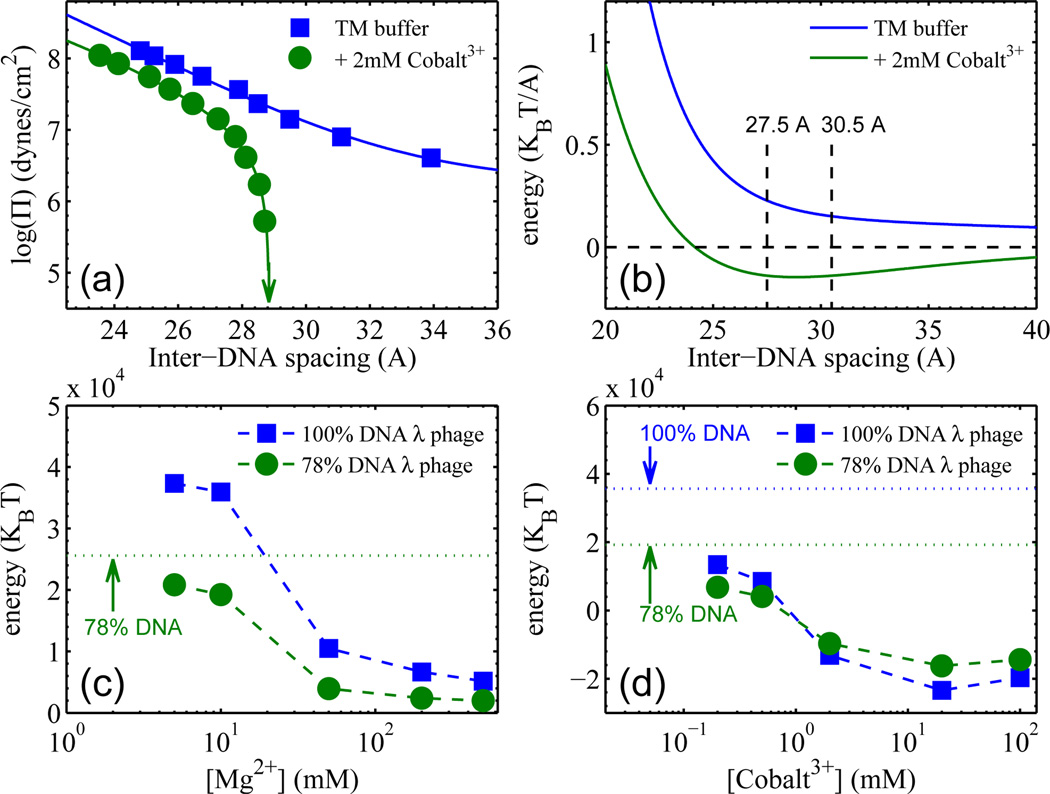
FIG. 3.
(a) Measured DNA-DNA pressure vs d-spacing curves for bulk DNA solutions in TM buffer, without and with 2 mM Cobalt3+. The arrow indicates the d-spacing under zero osmotic pressure. (b) Interaction energy per unit length, vs d-spacing, obtained by integration of pressures from (a). (c) & (d) Total interaction energies of DNA inside phage capsids, for two DNA lengths, determined from results like those in (b). Background buffer is 50mM Tris pH 7.5 for (c), and TM buffer for (d). The energies for zero [Mg2+] and for zero [Cobalt3+], determined experimentally, are indicated by dotted horizontal lines in (c) and (d), respectively. Note again that there is no “zero [Mg2+]” point for the 100% DNA strain (cI60).

