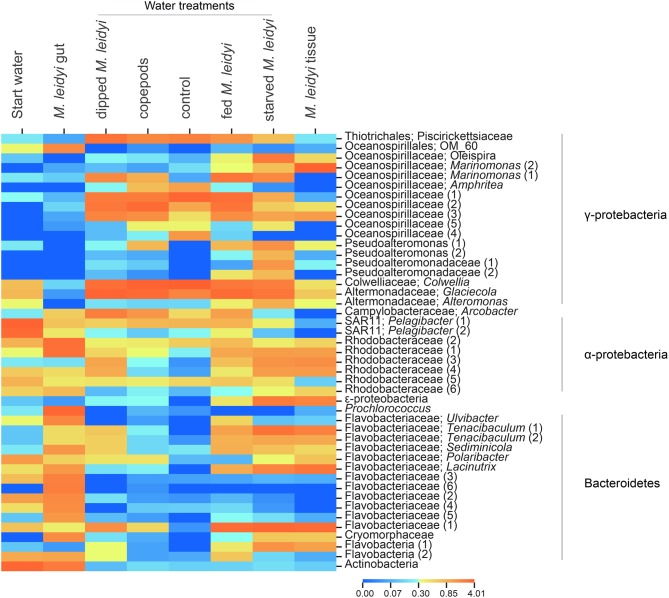
Figure 4.
Heatmap displaying the relative abundances of specific OTUs across the samples. Only OTUs with a sum of >100 assigned sequences across all samples were used. The color scale represents the log10+1 transformed relative abundance of the number of sequences. Duplicate OTUs were numbered sequentially for clarification.

