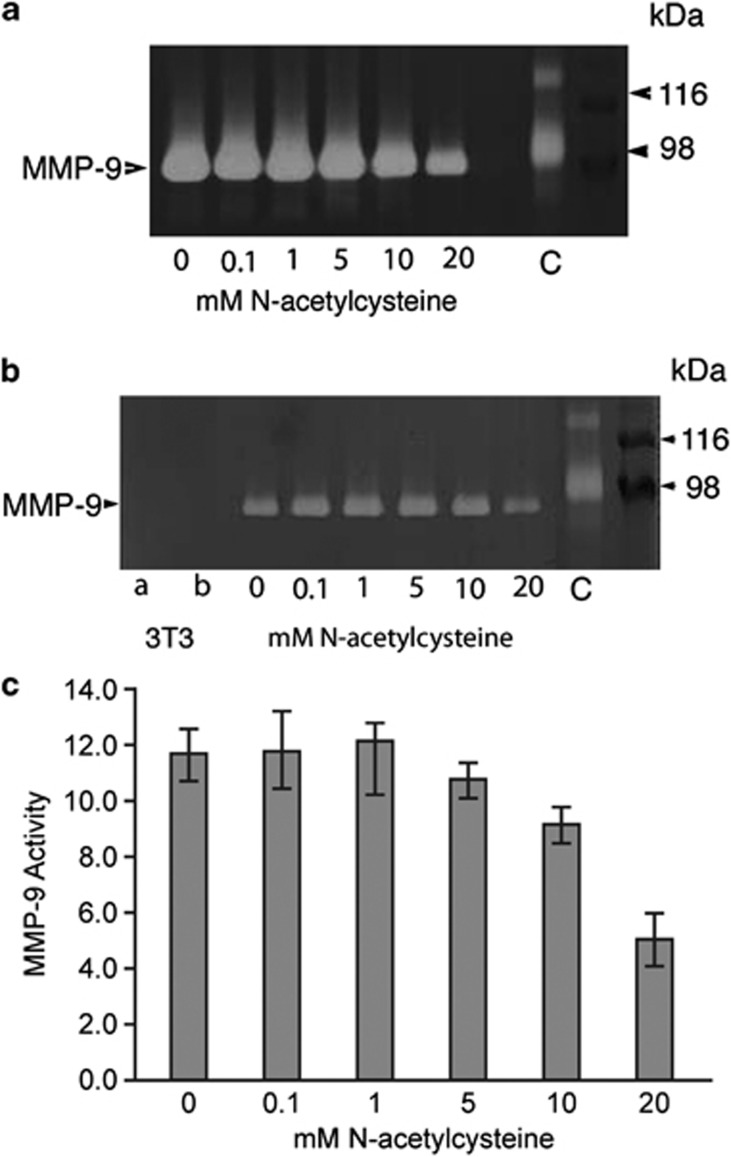
Figure 2.
Effects of NAC on MMP-9 secretion. (a, b) Gelatin zymography of conditioned media from cultured HCE cells treated with different concentrations of NAC. (a) Conditioned media exhibited strong bands at 92 kDa, corresponding to MMP-9 activity. (b) The same sample as in (a), loaded at a lower volume (1 μl). In the first two lanes, conditioned media of 3T3 cells was loaded at (a) 1 μl and (b) 7.5 μl, and they did not exhibit bands for MMP-9. C, control sample, human amniotic fluid, which contains MMP-9. Right: protein markers and the corresponding molecular weights. (c) Histogram showing the MMP-9 activity assay, expressed as optical densities of the bands (uOD). Each bar represents the mean±SEM of four samples. Pairwise comparisons showed significant differences between 0 vs 20 mM (P=0.0001), 0.1 vs 20 mM (P<0.0001), 1.0 vs 20 mM (P<0.0001), and 5 vs 20 mM (P=0.0005) NAC treatment groups.

