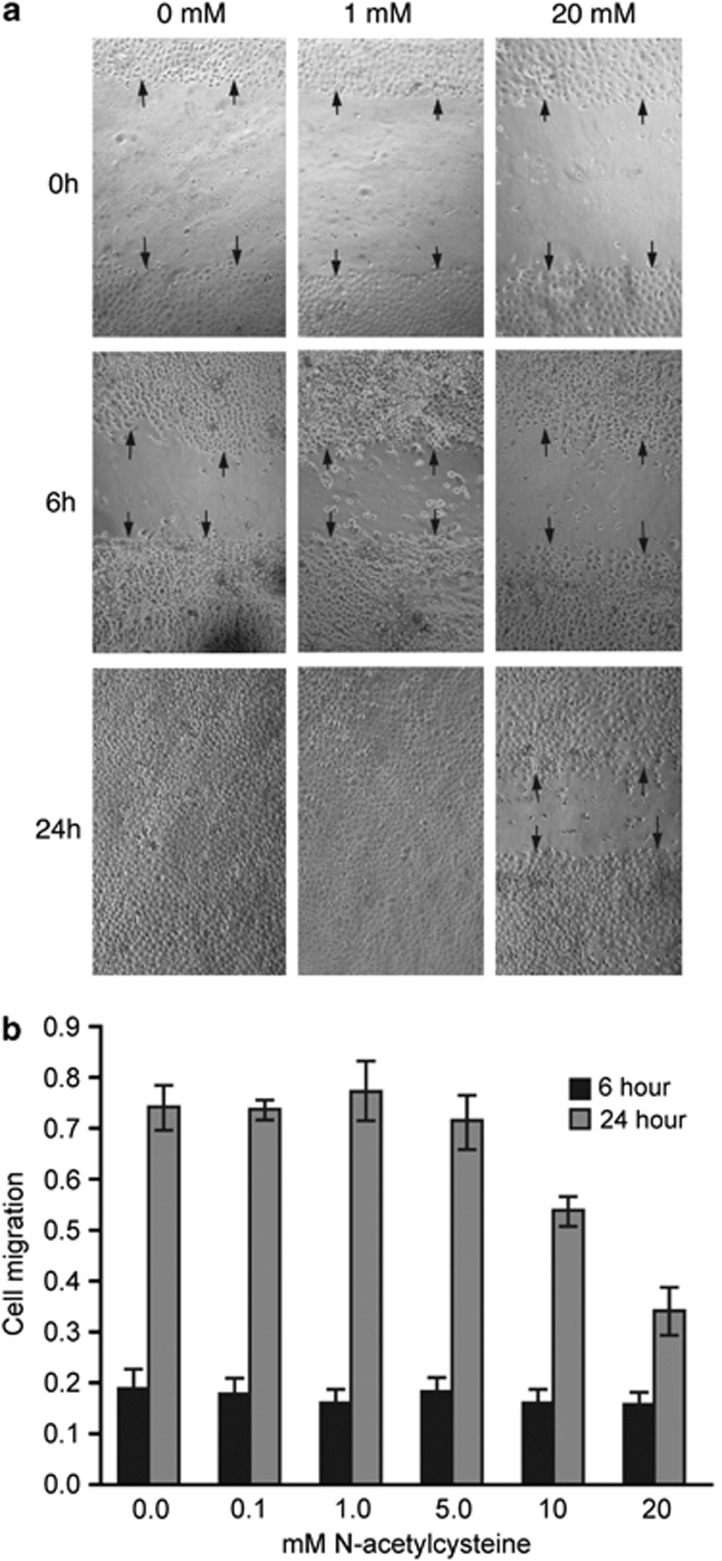
Figure 4.
Effects of NAC on corneal epithelial cell migration. (a) Representative phase contrast images of in vitro human corneal epithelial wound closure for three different concentrations (0, 1.0, and 20 mM) of NAC. Wound closure was photographed immediately (0 h), 6 h, and 24 h after wounding. Arrows indicate the edge of the wounds. (b) Histogram showing the migration of epithelial cells after 6 and 24 h for different concentrations of NAC. Each bar represents the mean±SEM of five samples. Multiple pairwise comparisons showed significant differences between 0 vs 10 mM (P=0.0029), 0 vs 20 mM (P<0.0001), 0.1 vs 20 mM (P<0.0001), 1.0 vs 10 mM (P=0.0008), 1.0 vs 20 mM (P<0.0001), and 5 vs 20 mM (P<0.0001) NAC treatment groups.

