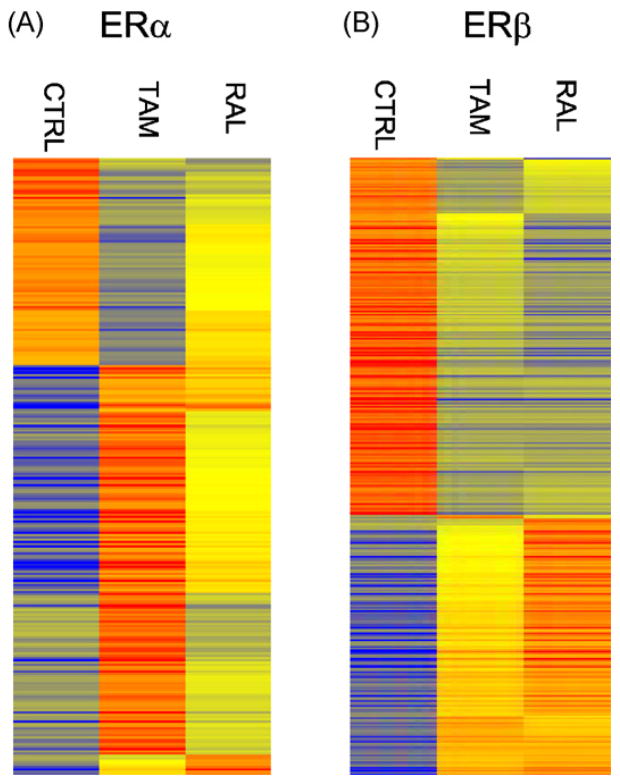
Fig. 2.
Heatmaps of log-intensities of the regulated genes by tamoxifen and raloxifene in U2OS-ERα or U2OS-ERβ cells. Genes regulated by at least one of the compounds in U2OS-ERα (A) or U2OS-ERβ cells (B) cells are shown in rows. U2OS-ERα or U2OS-ERβ cells were treated for 6 h with 1 μM tamoxifen (Tam) or raloxifene (Ral). For each gene (row), the average log intensities are colored yellow, relatively higher expression are colored with reds of increasing intensity, and relatively lower expression are colored with blues of increasing intensity. The controls and treated samples for microarrays were done in triplicate. Each activated gene was 2-fold or greater and each repressed gene was 0.5-fold or greater with p-values < 0.05.

