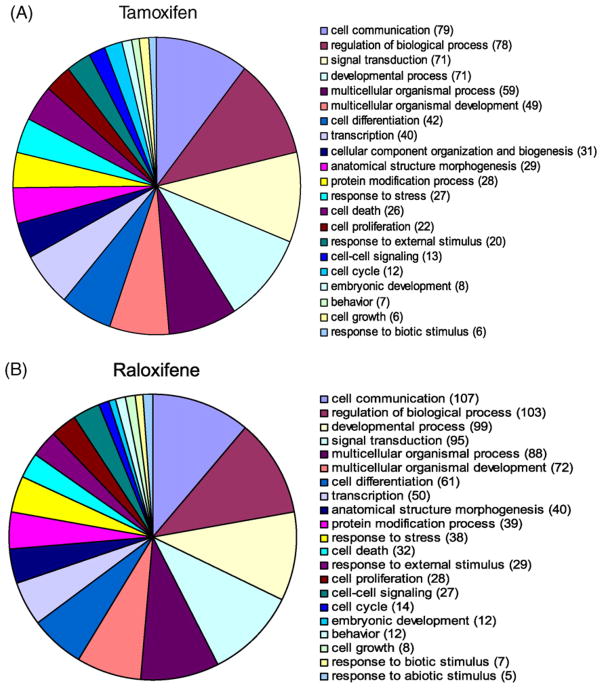
Fig. 5.
Pie charts comparing significantly enriched GO terms for genes regulated by tamoxifen or raloxifene in U2OS-ERβ cells. Gene ontology (GO) terms significantly enriched in various biological processes for genes regulated by tamoxifen (A) and raloxifene (B) in U2OS-ERβ cells. Threshold 0.05 was used for selecting GO terms using BH-adjusted p-values. Significant GO slim terms are presented in the pie chart. The number of genes regulated in the each biological class is shown in parentheses.

