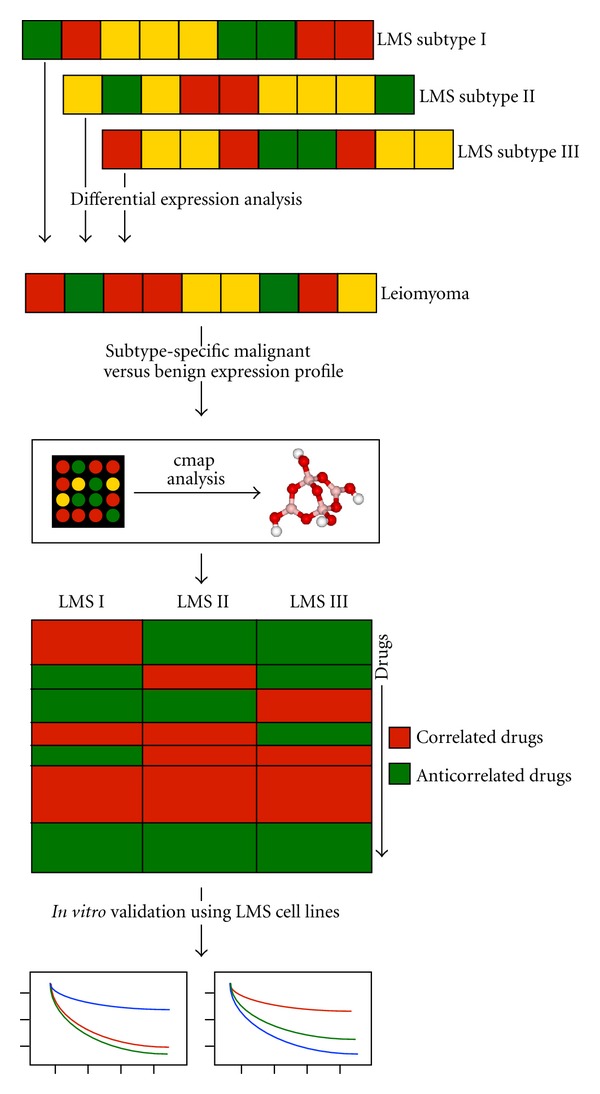
Figure 1.

Overview of analytical and experimental workflow. Gene expression profiles from each of the three LMS subtypes were compared to gene expression profiles from LM to identify the top 100 “up” and top 100 “down” differentially expressed genes for each subtype compared with LM. These three pairs of gene lists were then uploaded to cmap to estimate cmap enrichment scores linking drugs with LMS subtype expression signatures. 11 drugs, with a range of cmap enrichment scores, were then tested against three LMS cell lines using in vitro drug response experiments.
