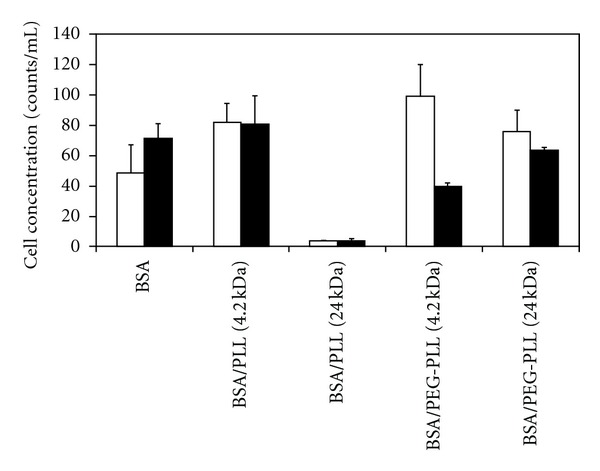
Figure 3.

Cell concentrations after exposure to blank NPs (□) and FAM-siRNA-containing NPs (■). The value in parentheses represents the molecular weight of the PLL in kDa. The NPs coated in PEG-PLL (4 kDa) and containing FAM-siRNA showed the greatest cell concentrations. Data represent average ±1 SD, n > 5.
