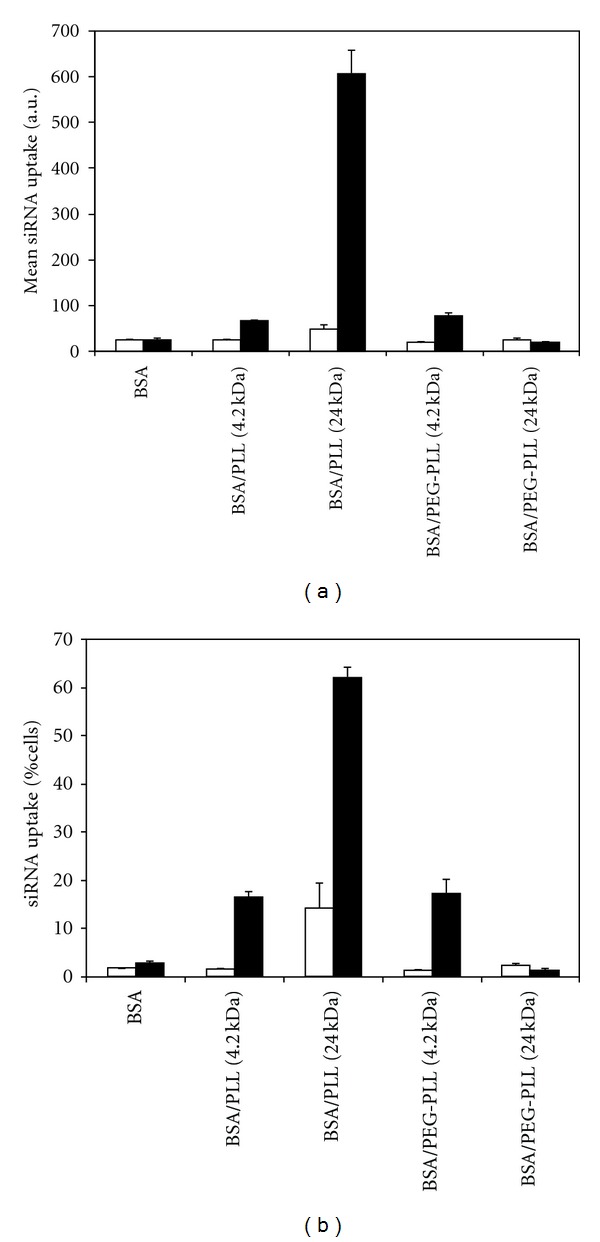
Figure 4.

Data summarizing the mean uptake and percent cellular uptake of labeled and unlabeled siRNA. (a) Mean (+1 SD) FAM fluorescence of the cells exposed to NPs without siRNA (□) and with siRNA (■). BSA NPs coated with 24 kDa PLL showed the greatest cellular uptake. (b) Mean (+1 SD) siRNA-positive cells when the cells were exposed to NPs without siRNA (□) and with siRNA (■). BSA NPs coated with 24 kDa PLL showed the greatest value of siRNA-positive cell population. The value in parentheses represents the molecular weight of the PLL in kDa.
