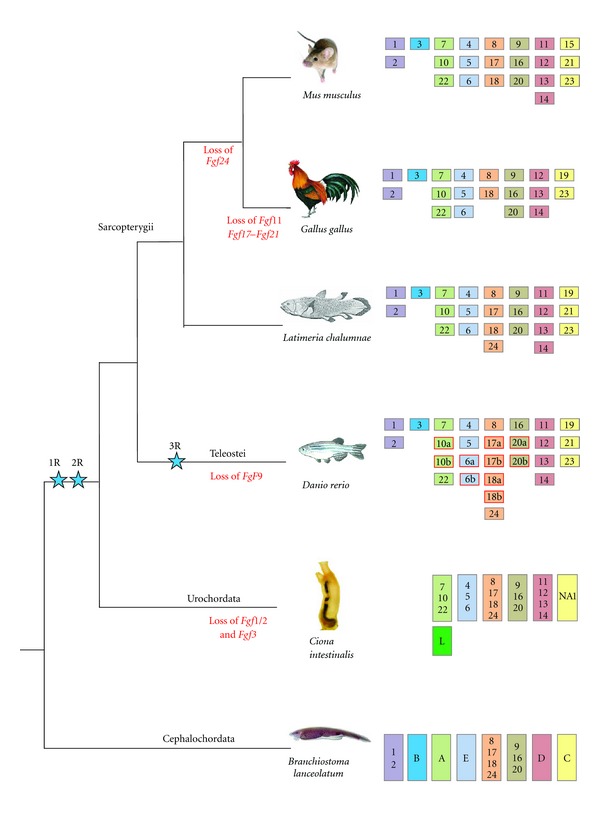
Figure 4.

FGF gene content in chordates. Each of the eight FGF paralogy groups is represented by one color. Gene losses are indicated under the tree branches and specific teleost duplications are outlined in red. The urochordate FGFL which is considered as a specific duplication of FGF7/10/22 in this group is colored in dark green. Blue stars represent genome duplications.
