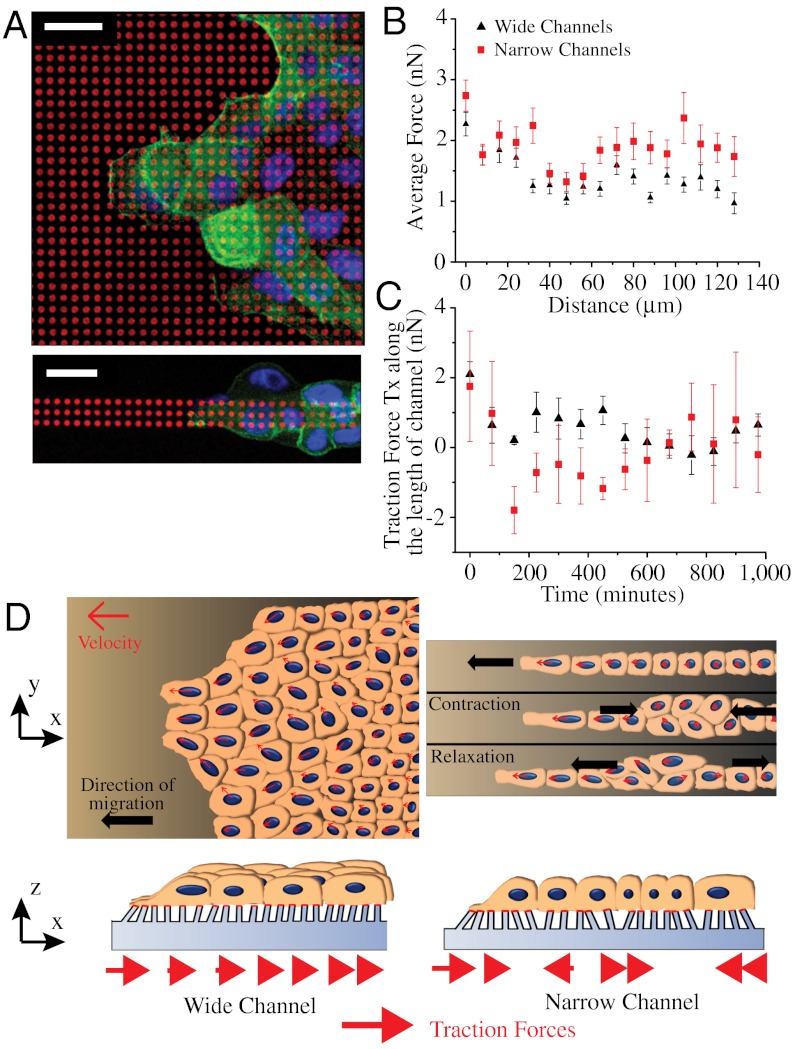
Fig. 4.
Geometrical constraints alter spatiotemporal distribution of cell-substrate traction forces. (A) MDCK cells migrating on fibronectin (red) stamped micropillar arrays of different widths fixed and stained for actin (green) and nucleus (blue). (B) Average cell traction forces as a function of distance from leading front on 400 and 20-μm wide strips. (C) Temporal evolution of Tx (component of traction forces along the length of the channel, deflection of pillars opposite the direction of cell sheet migration is considered positive) at a given region in the 400 and 20-μm wide micropillar arrays as the cell sheet migrates over it. The deflections of micropillars in a small window, initially at the cell edge, are tracked over time. (D) Cartoon depicting the movement of cells on wide (Right) and narrow (Left) strips on flat substrates (Upper) and micropillar arrays (Lower). (Scale bars, 20 μm).

