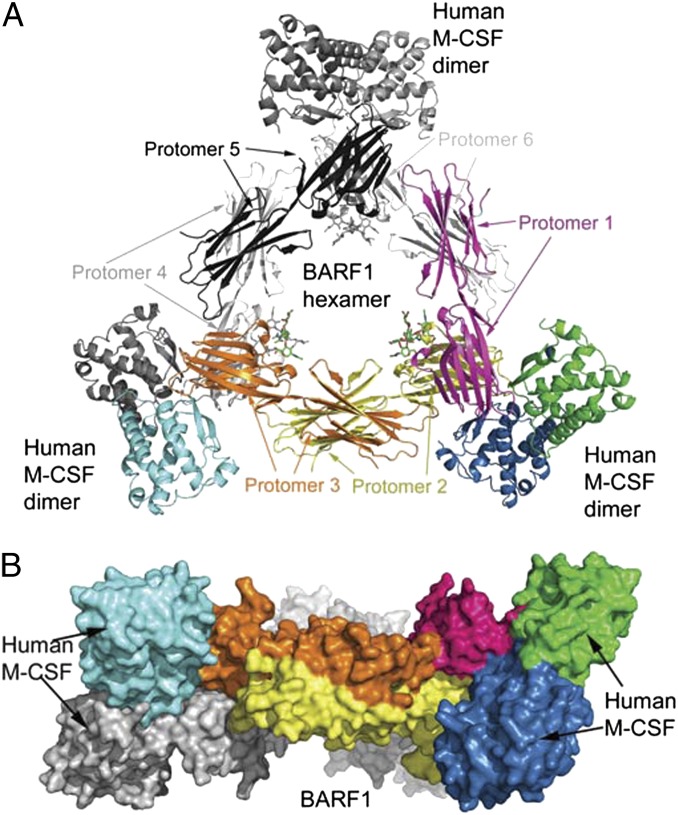
Fig. 2.
Structure of the 6:6 BARF1:M-CSF complex. (A) Ribbon model of the three M-CSF dimers (corners) bound to the BARF1 hexamer (center). The molecules in the asymmetric unit, corresponding to half the complex, are colored yellow, orange, and magenta for BARF1 and blue, green, and cyan for M-CSF. The other half of the complex, in gray, can be generated with the crystallographic twofold symmetry. N-linked glycans in the complex are depicted as sticks. (B) Surface representation of the complex, in an orientation 90° relative to A.

