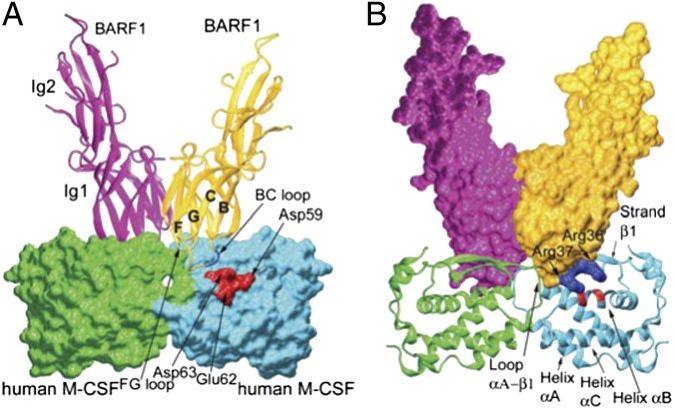
Fig. 3.
Interaction between each M-CSF dimer and two BARF1 protomers in the complex. (A) The BARF1 ribbon model on the M-CSF surface model, showing that the Ig1 domains of the BARF-1 molecules (ribbons) clamp the M-CSF dimer (surface) at the mutual dimeric seams. The strands leading to the BC and GF loops are marked as “B,” “C,” “F,” and “G”. (B) The BARF1 surface model on the M-CSF ribbon model, showing the M-CSF dimer fitting into the BARF1 groove. In both panels the clustered charge–charge interactions are shown in blue for positive charges and red for negative charges.

