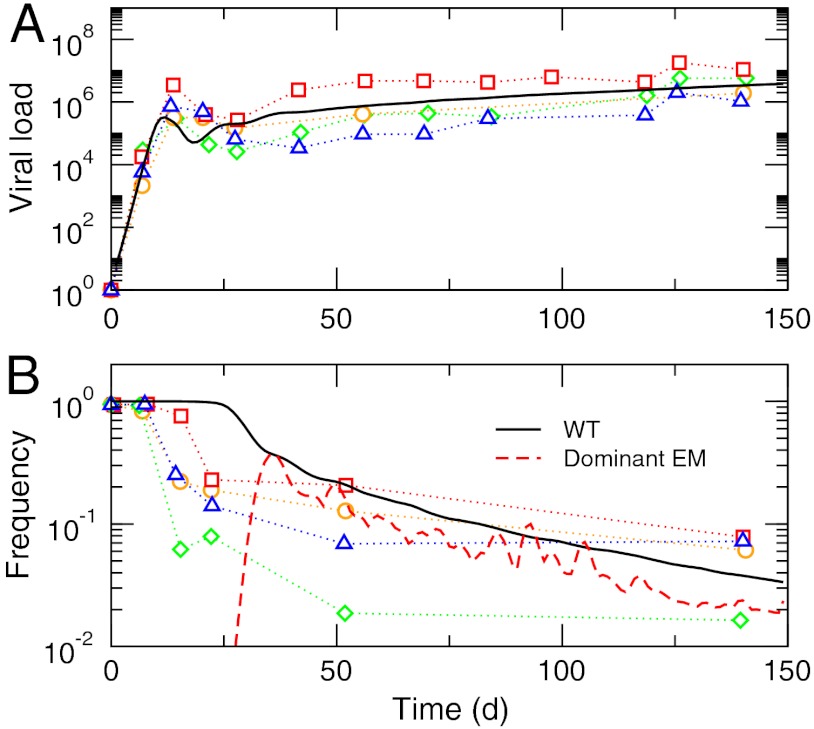
Fig. 1.
Simulation of full immune escape dynamics of a single SIV epitope Tat28–35SL8. (A) Viral load. (B) Frequencies of WT and the dominant escape mutants (EM). Symbols represent experimental data from refs. 9 and 22, with each symbol corresponding to one of four different animals. Solid lines are from our stochastic quasispecies model with τ = 0.8 d, μ = 2.0 × 10⁻⁷ bp-1, b = 0.01 d-1, g = 0.2 d-1, and p = 2.0 × 10⁻⁴ d-1. The fitness function parameters were σ = 0.1 and ξ = 1 (Methods). The EM frequency is for a single trajectory while the rest are averages.

