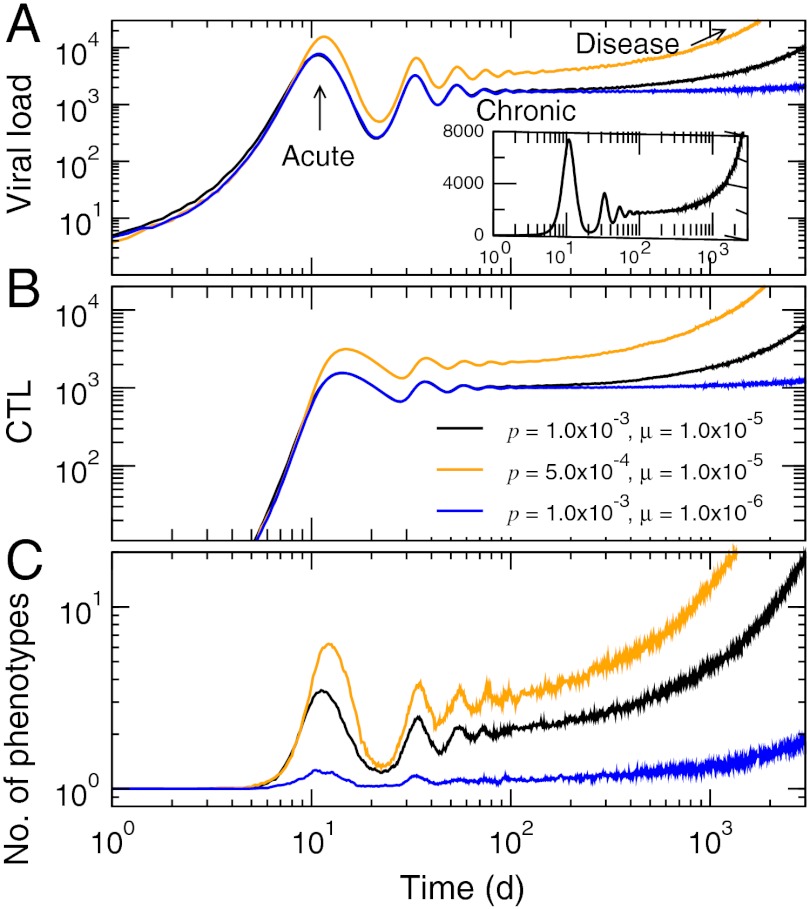
Fig. 2.
Typical disease progression patterns in the runaway regime from the multiepitope quasispecies model. (A) Viral load. (B) Total CTL levels. (C) Number of distinct phenotypes per epitope present in the population. The inset in A shows the viral load in linear scale for p = 1.0 × 10⁻³ d-1 and μ = 1.0 × 10⁻⁵ bp-1. Other parameter values were b = 0.02 d-1, g = 0.1 d-1, τ = 1 d, σ = 0.2, and ξ = 1. The units of p and μ in the legends are d-1 and bp-1, respectively. All data represent averages over trajectories.

