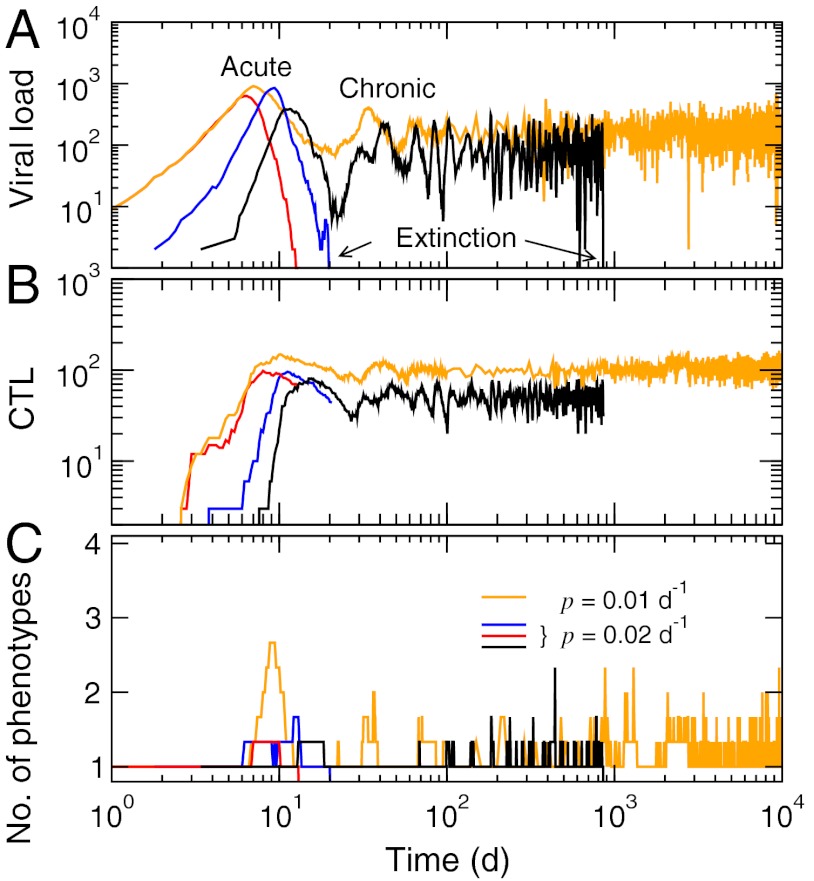
Fig. 3.
Typical disease progression patterns in the extinction regime from the multi-epitope quasispecies model. (A) Viral load. (B) Total CTL levels. (C) Number of distinct phenotypes per epitope present in the population. The parameter values other than p and μ = 1.0 × 10⁻⁵ bp-1 were the same as in Fig. 2. The data shown are individual trajectories.

