Fig. 2.
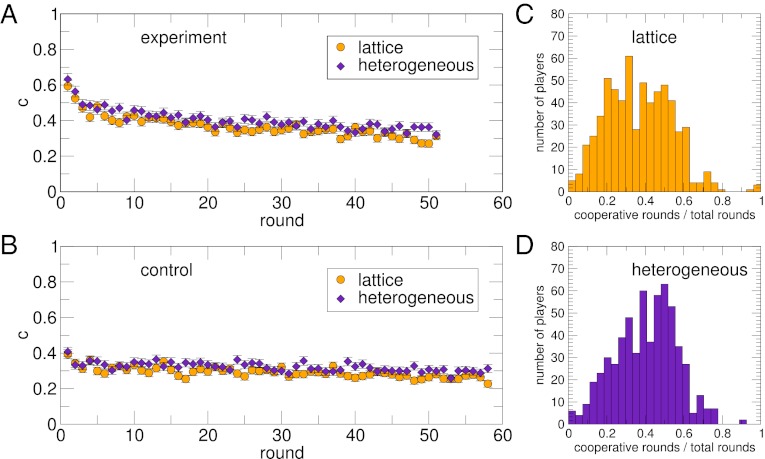
The level of cooperation declines and is independent of the network of contacts. Fraction of cooperative actions (level of cooperation) per round during the experiment (A) and the control (B) for both networks and histograms of cooperative actions in the lattice (C) and the heterogeneous network (D). The histograms (C and D) show the number of subjects ranked according to the fraction of cooperative actions that they perform along the experiment in the two networks. A Kolmogorov–Smirnov test shows that the distributions are statistically indistinguishable (SI Results and Discussion). They illustrate the high heterogeneity in subjects’ behavior—their levels of cooperation ranging from nearly zero to almost one in a practically continuous distribution. The corresponding histograms for the control (Fig. S4) show that a sizable group of subjects lowered their levels of cooperation, hence becoming mostly defectors. Actually, the decline in the level of cooperation observed in the experiment (A and B) can be explained as a constant flow of subjects to more defective strategies (evidence supporting this hypothesis in Figs. S5 and S6).

