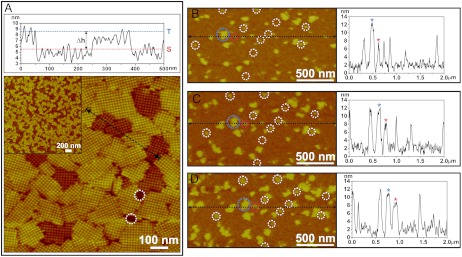
Fig. 1.
(A) AFM height profile and height image of 2D S-layers assembled on mica showing the two types of domains [incubation temperature (Ti) = 25 °C, protein concentration (CP) = 41 μg/mL in a buffer solution of 10 mM tris(hydroxymethyl)aminomethan (Tris), pH 7.2, 50 mM CaCl2, 100 mM NaCl]. The height profile (Top) measured along the black dotted line in the height image shows the average difference in domain height (Δh) as measured between the blue (tall phase: T) and red (short phase: S) dotted lines is approximately 3 nm. The average height of the tall domains measured from the mica surface (highlighted by white dotted circles) corresponds to ca. 8–9 nm, which is consistent with measurements of S-layers on SLBs. (B–D) Time sequence of in situ AFM images and height profiles showing the early stage of S-layer assembly (CP = 70 μg/mL, Ti = 25 °C). White circles highlight initial nuclei formed from the adsorbed proteins. Height profiles were measured along the horizontal dotted black lines in each image. Blue and red circles in each image highlight a pair of clusters, one tall (blue) and the other short (red). They are denoted in the height profiles by the blue and red stars, respectively, and maintain a consistent height difference of approximately 3 nm during the observed growth period. The nonzero baselines in each height profiles denote the level of the adsorbed monomers, which have an average height of approximately 2 nm. The images were captured at (B) 37, (C) 48, and (D) 59 min after start of the in situ growth experiment.

