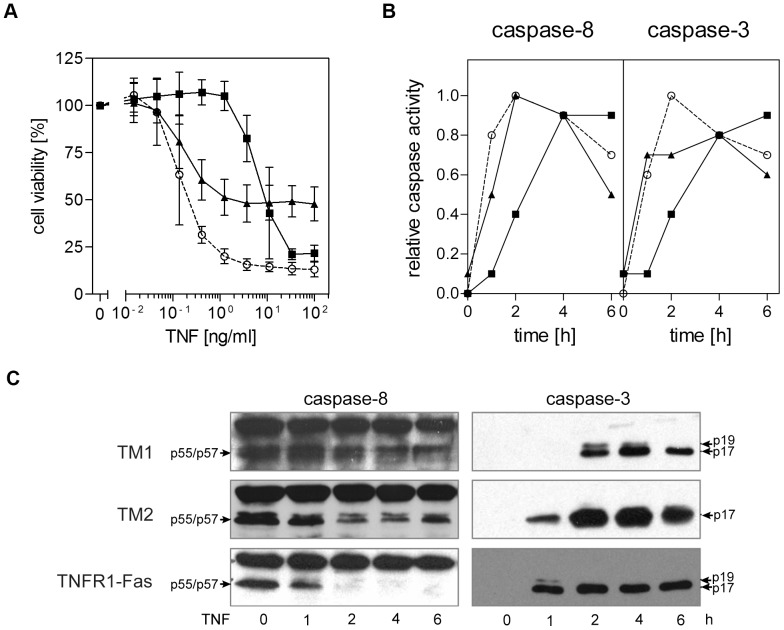
Figure 5. The transmembrane and stalk regions of TRAILR1 and TRAILR2 regulate apoptotic signaling.
A. Cytotoxic effects of TNF in TM1, TM2 and TNFR1-Fas expressing mouse fibroblasts. MF-TM1 (closed squares), MF-TM2 (closed triangles) or MF-TNFR1-Fas (open circles) cells were treated with serial dilutions of TNF and cell viability was determined by crystal violet staining after 6 hours of stimulation. All experimental groups shown were performed in parallel: one representative experiment out of three is shown. B. Caspase-8 (left panel) and caspase-3 (right panel) enzymatic activities following triggering of TM1, TM2 and TNFR1-Fas (closed squares, closed triangles and open circles, respectively) positive cells with TNF were determined using specific fluorogenic substrates (Ac-IEPD-AMC and Ac-DMQD-AMC, respectively). Data from a representative experiment out of three are shown. The graphs depict normalized caspase activities (maximum relative activity = 1), as absolute activity values are likely to be strongly influenced by the differential expression levels of the chimeric receptors. C. Western blot analyses performed using procaspase-8- and cleaved caspase-3-specific antibodies. Cells stably expressing chimeric receptors were treated with TNF (100 ng/ml) for the indicated times, followed by cell lysis.

