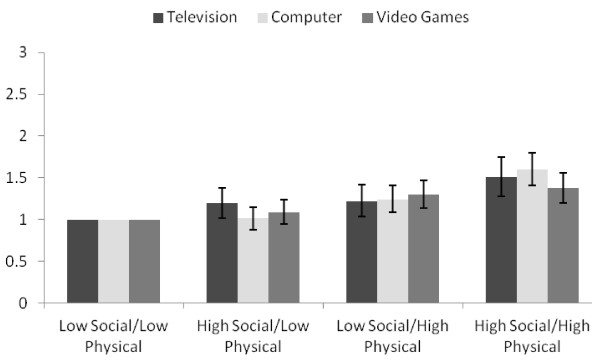
Figure 1.
The combined influence of social and physical neighborhood disorder on television, computer, and video games. Prevalence ratios and 95% confidence intervals for high television, computer, and video game use according to combined social and physical neighborhood disorder groups. All models were adjusted for neighborhood SES and the computer model was also adjusted for grade. Low social/low physical = bottom 3 quartiles of social and physical neighborhood disorder; high social/low physical = top quartile of social neighborhood disorder and bottom 3 quartiles of physical neighborhood disorder; low social/high physical = bottom 3 quartiles of social neighborhood disorder and top quartile of physical neighborhood disorder; and high social/high physical = top quartiles of social and physical neighborhood disorder.

