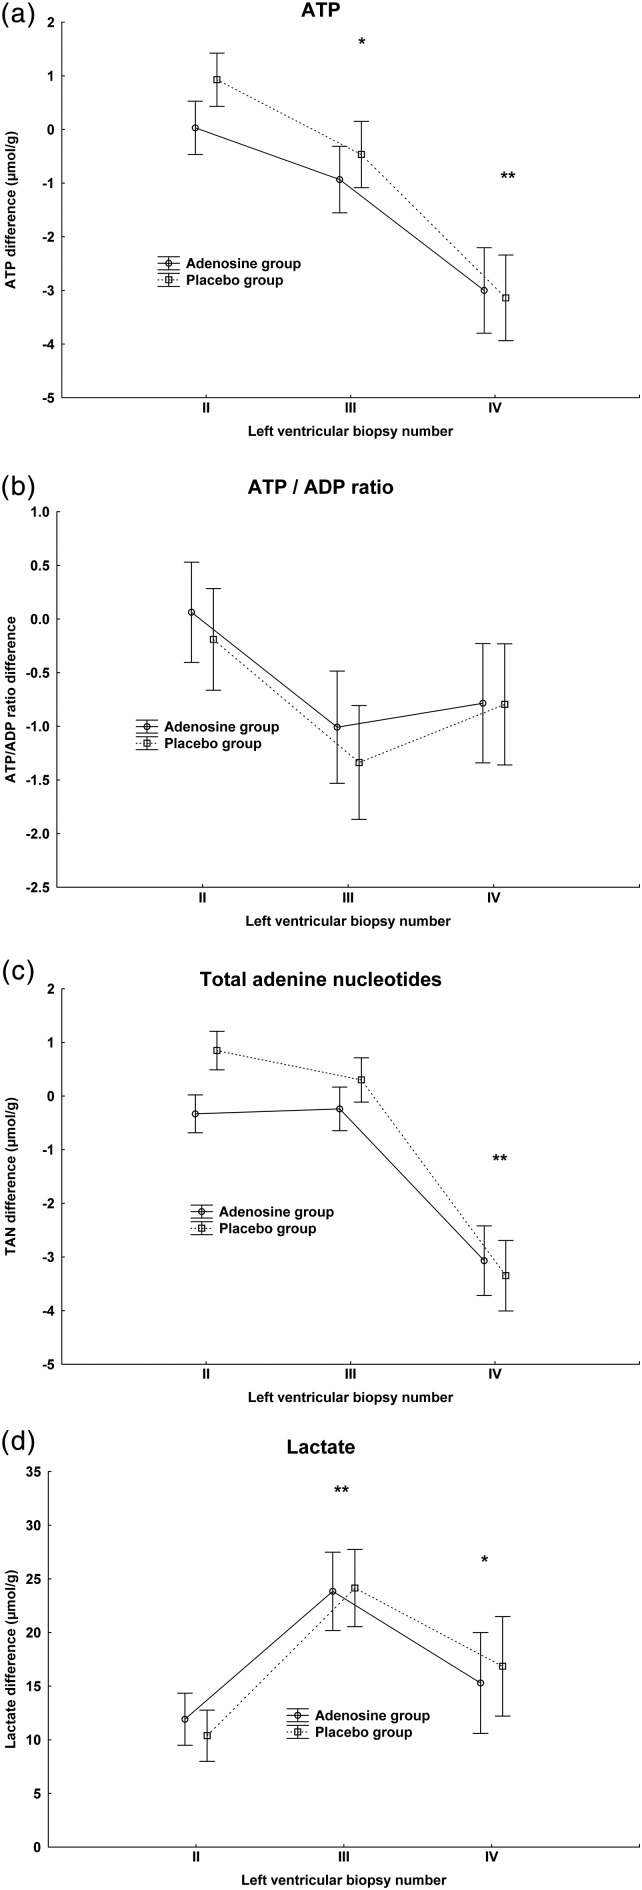
Figure 3:
Concentration differences of adenine nucleotides and lactate in myocardial biopsies obtained after bolus cardioplegia (II), at 60 min of aortic occlusion (III) and at 20 min after release of aortic occlusion (IV). All values are subtracted from control biopsy before aortic occlusion (I). Vertical bars denote ±standard error of the mean. Post hoc significance test of time differences between biopsies are marked with an asterisk. ATP concentration: *P < 0.05 compared with biopsy II. **P < 0.01 compared with biopsy II. Total adenine nucleotide concentration: P < 0.01 compared with biopsy II. Lactate concentration: *P < 0.05 compared with biopsy I. **P < 0.01 compared with biopsy I.

