
Figure 1.
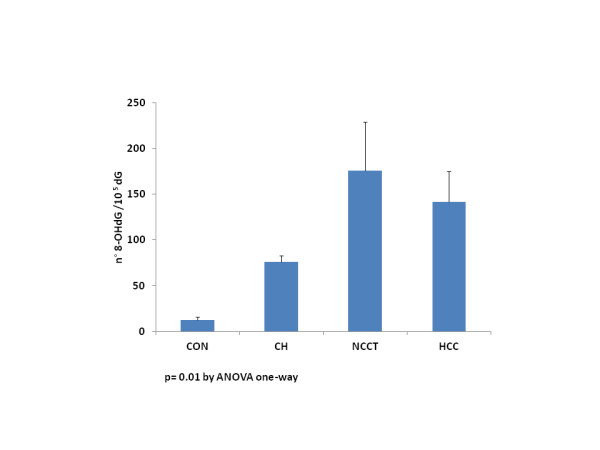
8-OHdG levels in liver tissues in different stages of the disease progression. 8-OHdG mean levels were significantly higher in NCCT than in other groups (CON, CH, HCC), p = 0.01 Anova one-way. CON Controls (10), CH HCV and HBV Positive Chronic Hepatites Tissues (22), NCCT Non-Cancerous Cirrhotic Tissues (29), HCC Neoplastic Tissues (29).