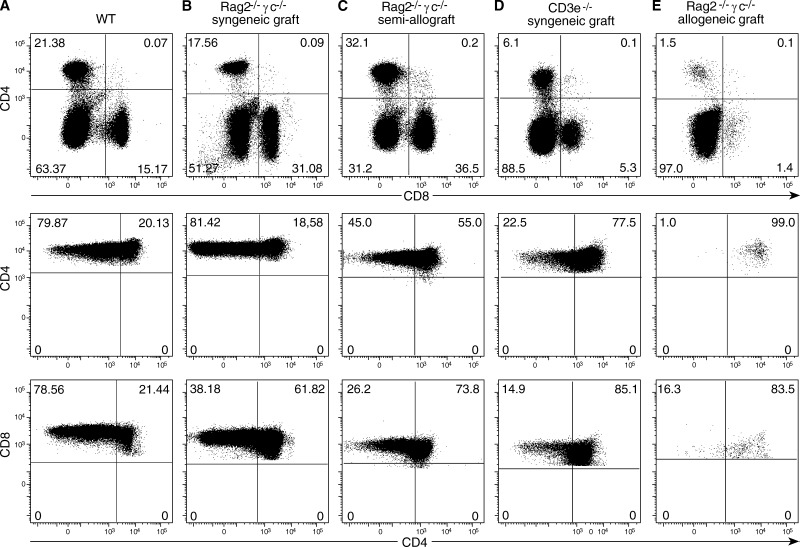
Figure 4.
Peripheral reconstitution after thymus transplantation in different conditions. Different host mice were transplanted with neonatal thymi and studied 1 mo later. Top dot plots show the distribution of CD4/CD8 T cells, and bottom dot blots show the ratio of naive and CD44+ activated cells in the spleen, in one out of five equivalent experiments.

