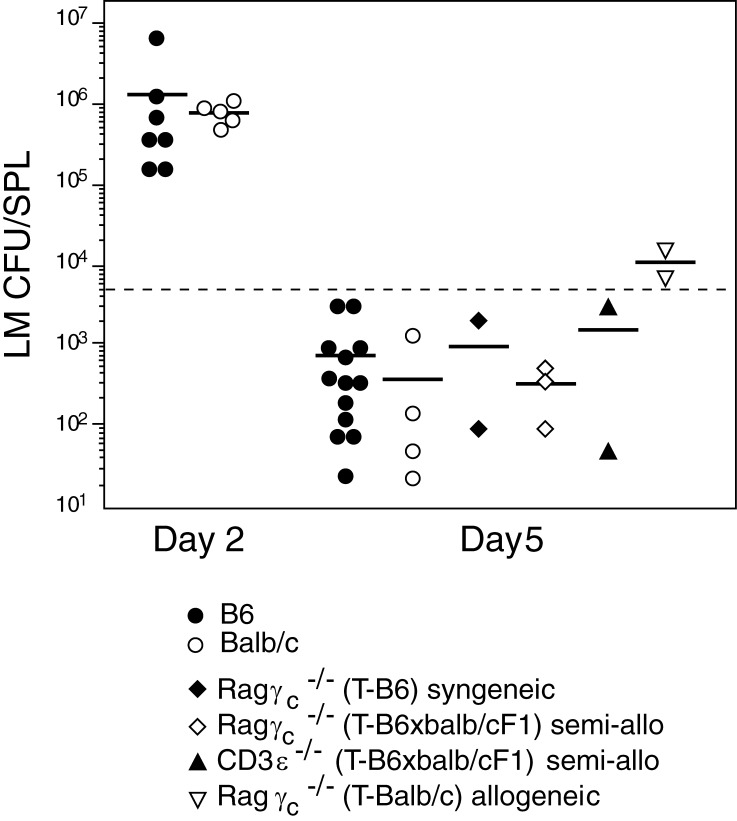
Figure 5.
The capacity of thymus transplants to protect from infection. WT B6 and BALB/c controls and the transplanted mice described in Fig. 4 were injected i.v with live LM. The dotted line shows the number of injected LM. Results show bacteria loads evaluated as LM CFU/spleen at day 2 and 5 after infection, each point showing an individual mouse. T denotes the genotype of donor thymus.

