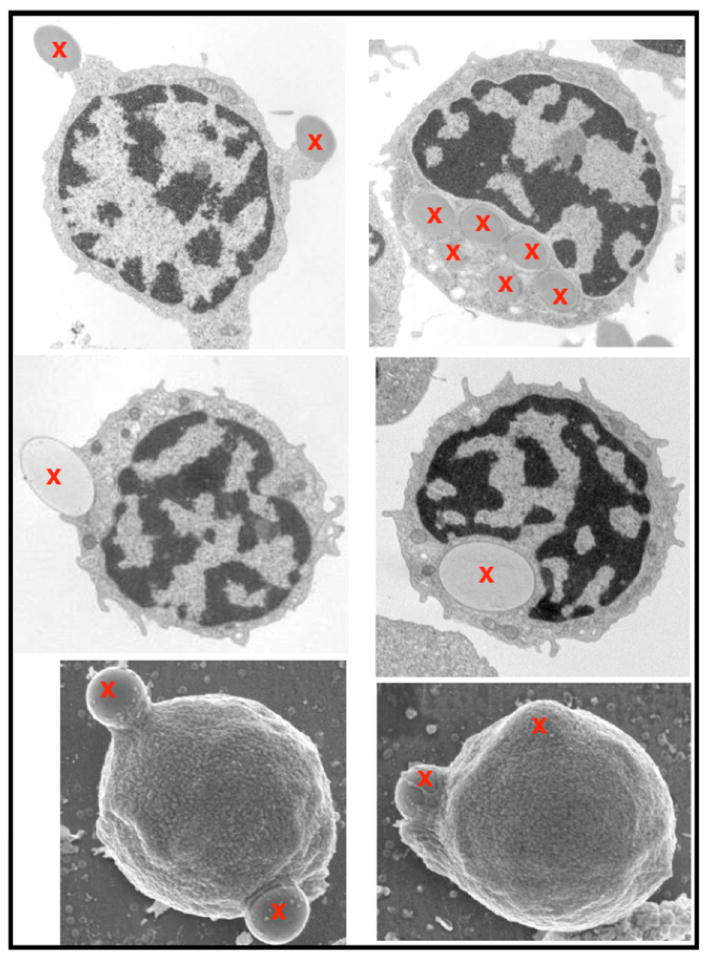
Fig. (1). Transmission and scanning electron microscopy analysis of fish phagocytic B cells.

Rainbow trout IgM+ B cells can be seen in the process of internalizing 1 μm or 2 μm latex beads (left images) or with internalized beads (right images). Upper and middle panels are TEM images, whereas the bottom panels are SEM images. Beads are marked with a red X. Images were taken from (51) and reproduced with permission of Nature Immunology.
