
Figure 3.
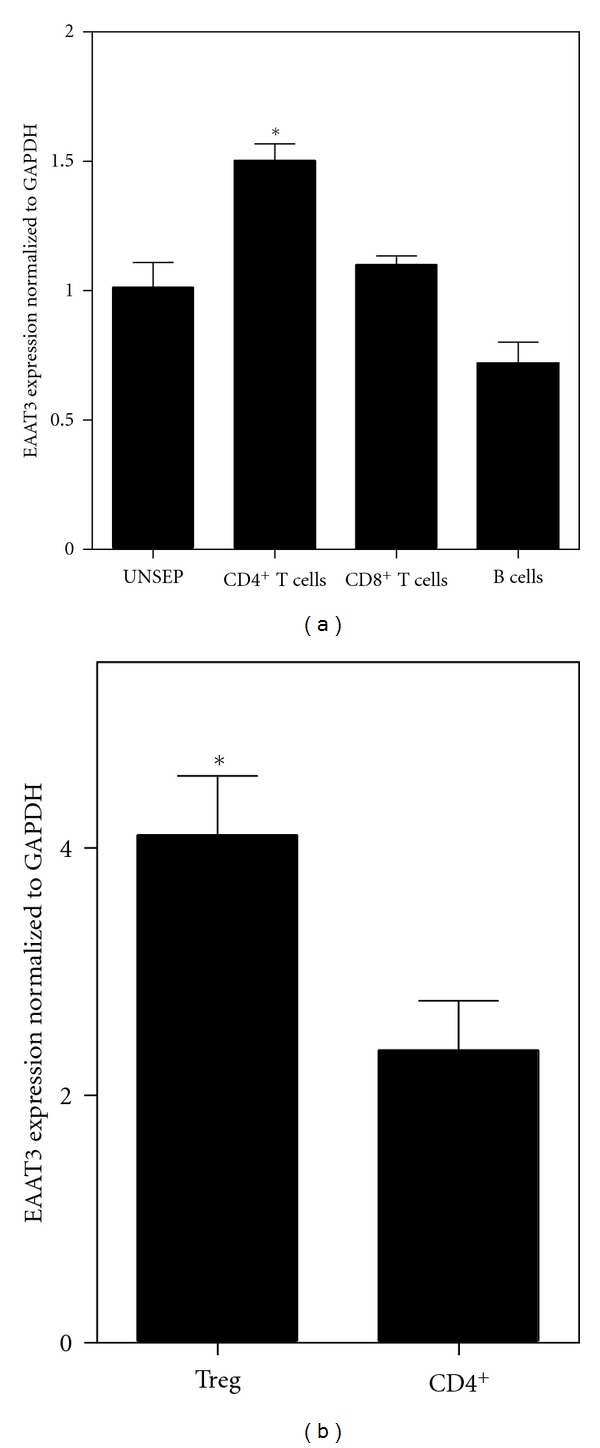
Expression of EAAT3 in murine lymphocyte subsets. Spleen and lymph node-derived lymphocytes were separated by magnetic cell sorting, followed by qRT-PCR analysis for EAAT3 (EAAC1) expression. (a) EAAT3 expression was significantly higher (P < 0.05) in CD4+ T cells as compared to unseparated lymphocytes (UNSEP), CD8+ T cells, or B cells. (b) EAAT3 expression was significantly higher (P < 0.05) in FoxP3+ Treg cells.