Figure 2.

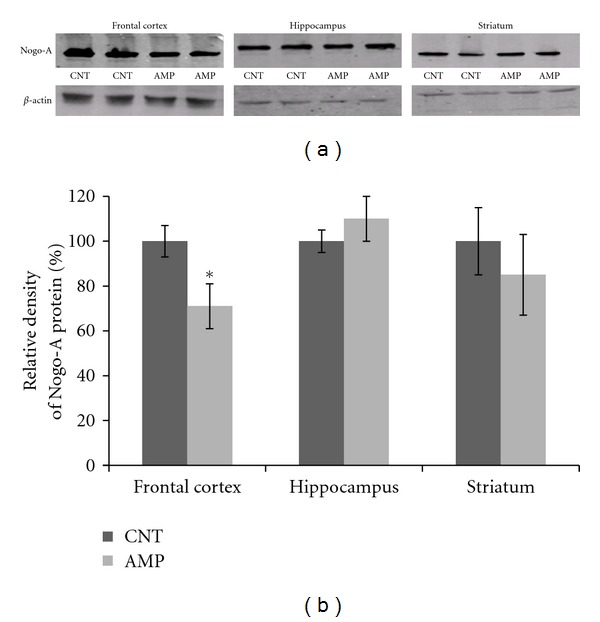
AMP reduced the amount of Nogo-A protein in the frontal cortex. After treating with d-AMP or a same volume of saline for 21 days and subjected to behavioral tests, mice were sacrificed, their brains were dissected, and tissue samples from specific brain regions were processed for Western blot analysis. The amount of Nogo-A protein in the frontal cortex, hippocampus, and striatum was measured. (a) shows representative Western blot images and (b) is a bar chart illustrating the statistical analysis of the Western blot results. Data were expressed as means ± SEM. Comparisons were made between CNT and AMP groups. *P < 0.05. Of 6 PFC samples in AMP group, one showed a ratio (1.5) of Nogo-A protein/β-actin higher than the average of CNT group (1.4).
