
Figure 3.
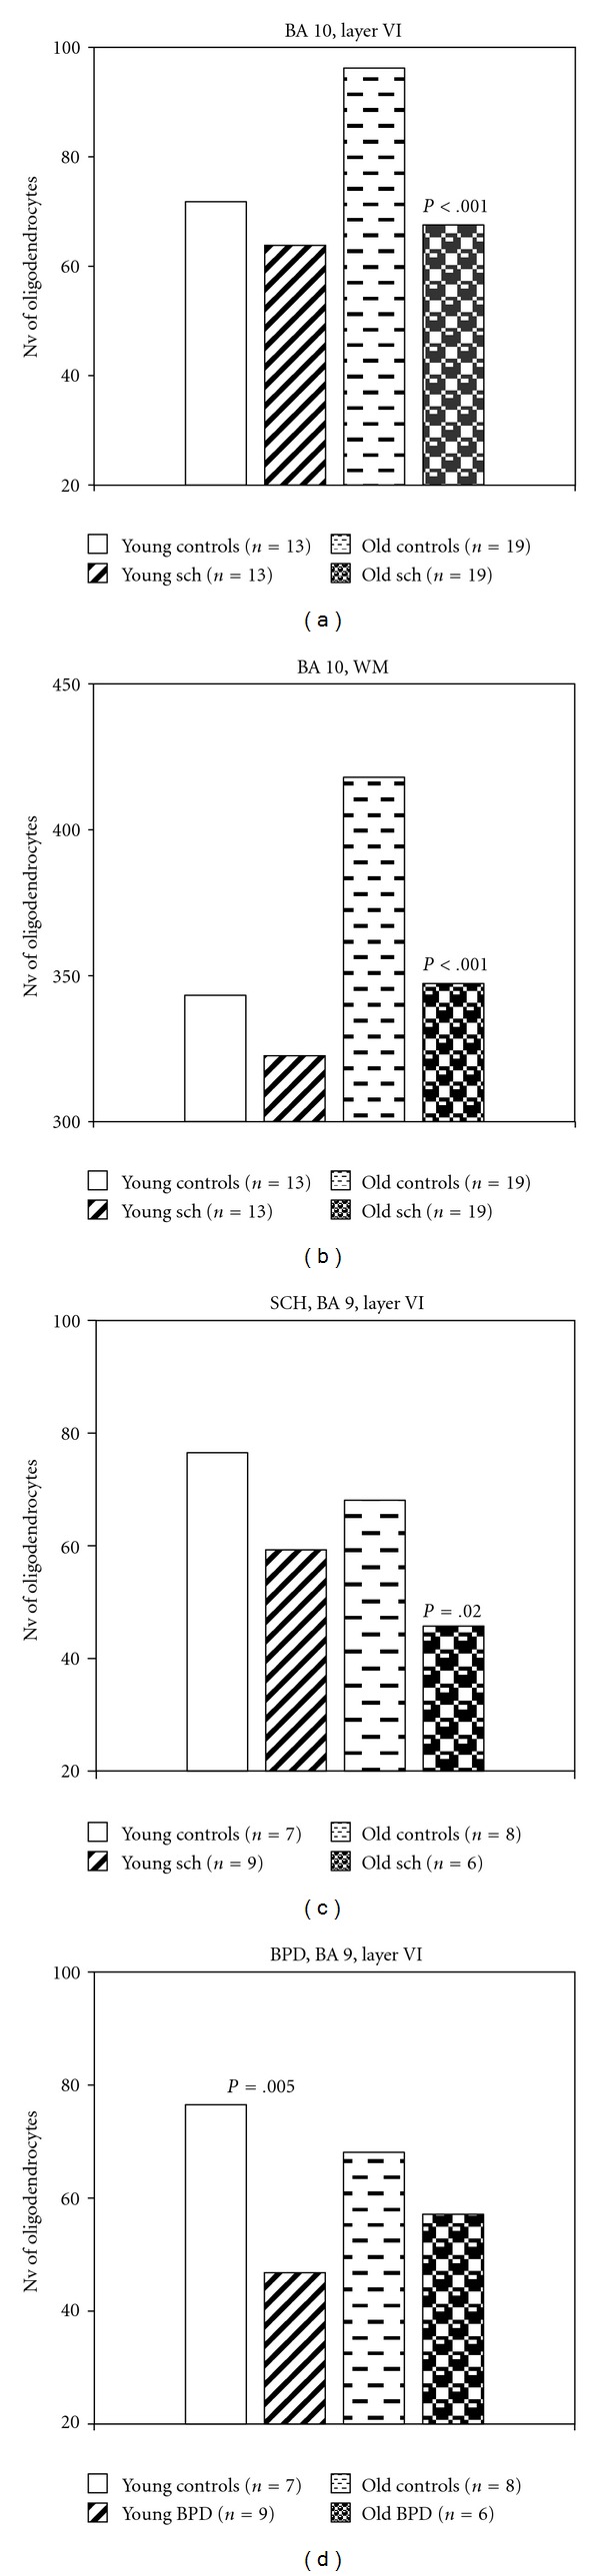
Plots summarizing results of comparisons of young and elderly patient subgroups with young and elderly controls.
Official websites use .gov
A
.gov website belongs to an official
government organization in the United States.
Secure .gov websites use HTTPS
A lock (
) or https:// means you've safely
connected to the .gov website. Share sensitive
information only on official, secure websites.
Plots summarizing results of comparisons of young and elderly patient subgroups with young and elderly controls.