Figure 4.

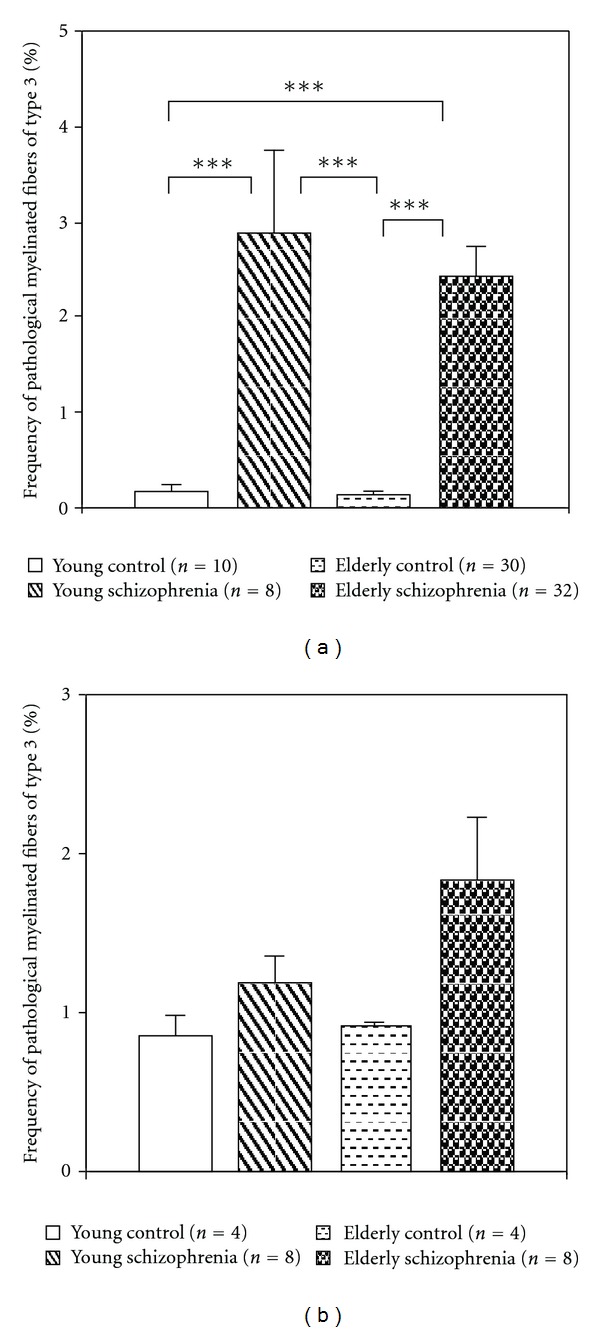
Histograms demonstrating the results of comparisons of the frequency of pathological myelinated fibers of type 3 in young and elderly patient subgroups with young and elderly controls. (a) Gray matter, (b) White matter (mean ± SEM).

Histograms demonstrating the results of comparisons of the frequency of pathological myelinated fibers of type 3 in young and elderly patient subgroups with young and elderly controls. (a) Gray matter, (b) White matter (mean ± SEM).