
Figure 1.
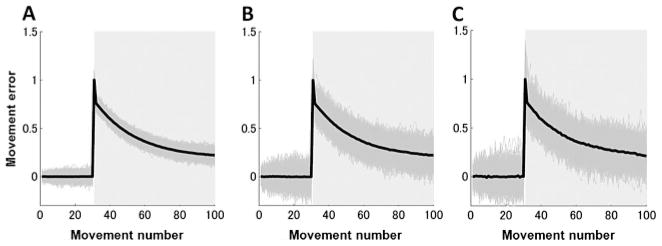
Typical error curves generated by simulating the two-state model, equation 2.1, with (A) and , (B) and , and (C) and . Thin gray lines depict individual realizations, and thick black lines depict average error curves. External perturbations are 0 in trials 1–30 and 1 in trials 31–100 (shaded areas).