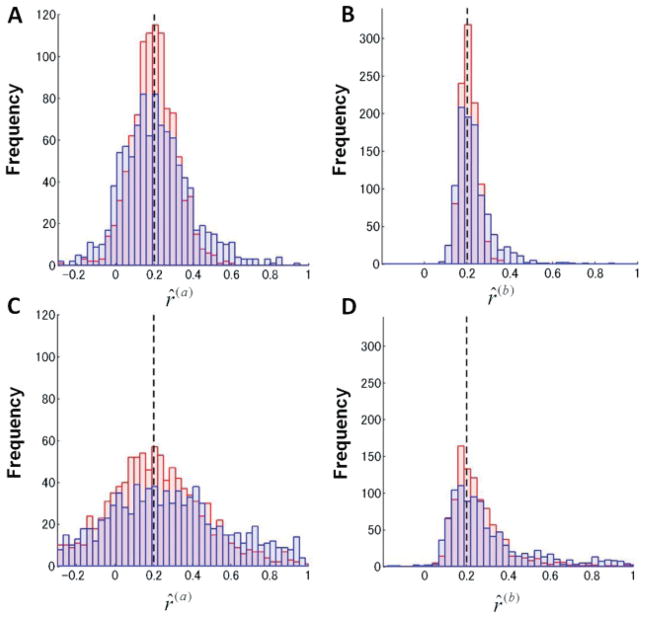
Figure 3.
Distributions of the estimated coefficient ratios by Monte Carlo simulations using ML estimation (red histograms) and PE estimation (blue histograms) for noise values (A, B) and and (C, D) and . The dashed vertical lines indicate the value of the ratios used to generate artificial error data.

