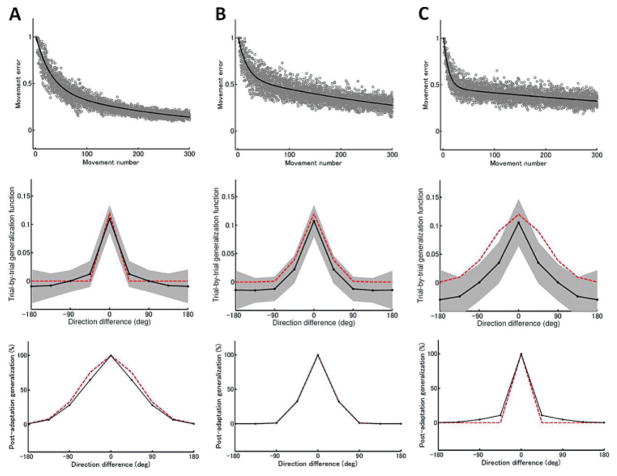
Figure 8.
Double exponential learning curves (top row), trial-by-trial generalization functions (middle row), and postadaptation generalization functions (bottom row) computed from a two-state state-space model with various widths for the fast process’s B(f) and the slow process’s B(s) matrices defined in equations 3.1 and 3.2. (A) narrow B(f) and broad B(s), (B) moderate B(f) and B(s), and (C) broad B(f) and narrow B(s). Red lines denote generalization functions used to generate error data. The learning curves were computed from 10 independent runs and fitted by a double-exponential function (thick black line). Trial-by-trial generalization was assessed using the initial 50 trials, and postadaptation generalization was assessed after 300 trials.

