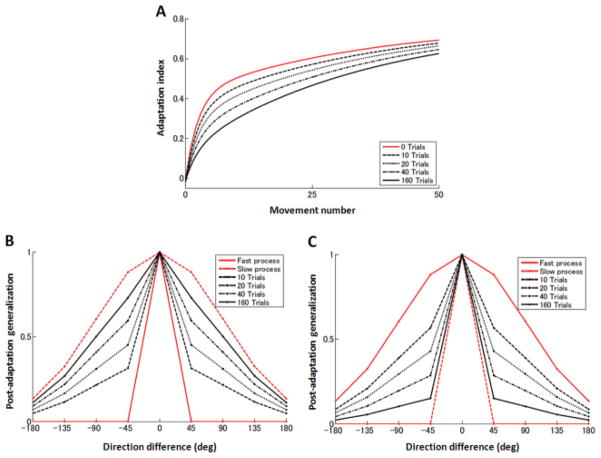
Figure 9.
(A) Learning curves of opposite perturbations (−1) (aligned at the zero crossing point) after learning positive perturbations for 10, 20, 40, and 160 trials. The red solid line denotes the learning curve without prior learning as a comparison. (B, C) Gradual transition in the shape of postadaptation generalization after learning positive perturbations for 10, 20, 40, and 160 trials. The red solid and dashed lines show the normalized generalization functions for the fast and slow systems, respectively.

