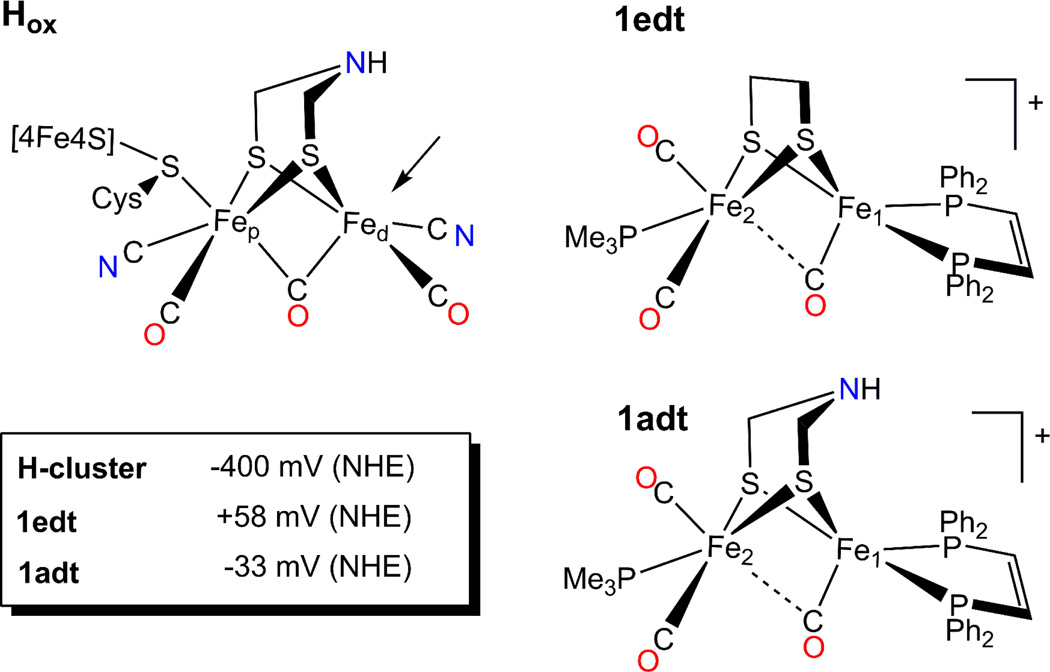
Figure 1.
Schematic representation of the H-cluster in the Hox state and model compounds used in this study. An Arrow points to the vacant apical site on the distal Fe, which in the case of the enzyme, is the site for binding H2. Insert: midpoint potentials for the Hred/Hox and [Fe2(SX)2]0/+ redox transition for the H-cluster and the models 1edt and 1adt, correspondingly. For the H-cluster it is specified for pH 8 15 in Tris buffer with KCl electrolyte, for the model compounds the E0 values are given for [(C4H9)4N]PF6 electrolyte in CH2Cl2 22 and values are converted from vs Fc0/+ to vs NHE scale by using E0(Fc0/+) = +0.528 vs NHE estimation.

