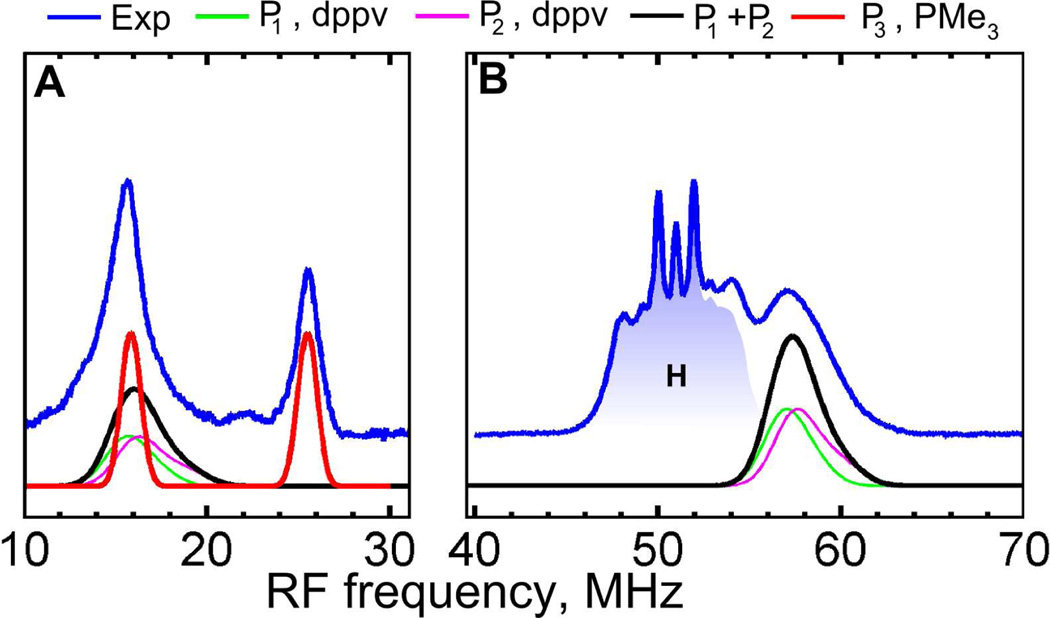
Figure 3.
Q-band Davies ENDOR spectra (blue) of 1edt measured at T = 20K and 1197.8 mT. Simulations were performed using P1,2,3 parameters from Table 1. The 1H ENDOR region is shaded blue for clarity. Experimental conditions: A, tRF = 35 µs; νmw = 33.8708 GHz; tinv = 200ns. B, tRF = 5.5 µs; νmw = 33.8708 GHz; tinv = 80 ns; see also Figure S2 in SI for complete field dependence.

