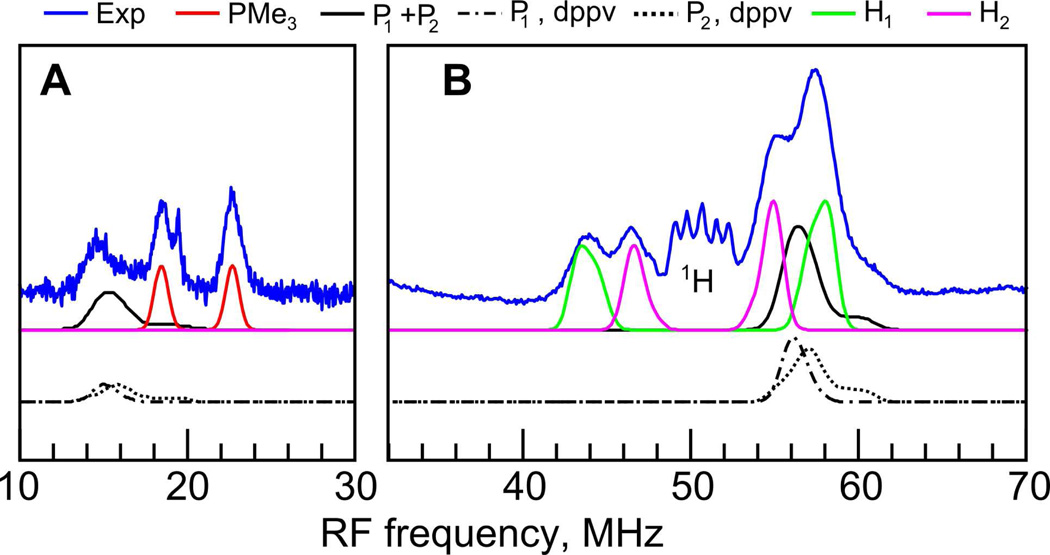
Figure 8.
Q-band ENDOR spectra of 1adt measured at 20 K and field position 1192.8 mT (gy). Low frequency spectra (A) were recorded using the refocused Mims ENDOR sequence with τ = 108 ns and t(π/2) = 16 ns, whereas the high frequency part (B) was recorded using Davies ENDOR, tinv = 44 ns (suppressing matrix 1H signals), t(π/2) = 16 ns, τ = 400 ns. Simulations were performed using the HF coupling constants listed in Table 1. See also Figure S3 in SI for complete field dependence.

