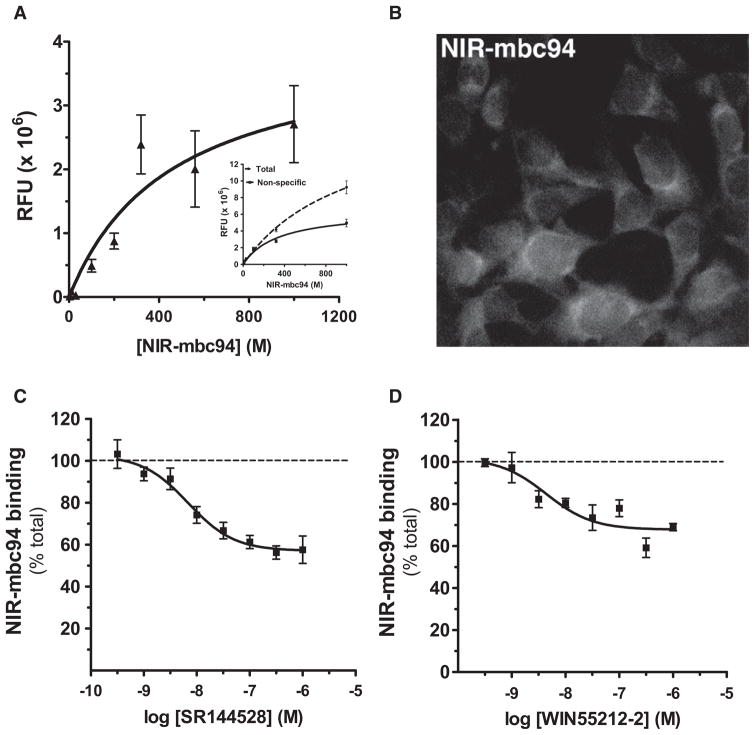
Figure 2. NIR-mbc94 Binds to CB2 Receptors Expressed by Intact Cells: Heterologous Expression.
(A) Saturation and competition of NIR-mbc94 binding to CB2 receptors. Fluorescent signal emitted by increasing concentrations of NIR-mbc94 bound to CB2 mid DBT cells was measured with a Li-Cor Odyssey scanner. Specific binding data are expressed as fluorescence values or relative functional units (RFU on the y axis) as a function of MI concentration (on the x axis). Data points for specific binding were obtained by subtracting the amount of fluorescence emitted by NIR-mbc94 incubated with CB2 mid DBT cells minus fluorescence emitted by NIR-mbc94 incubated with untransfected DBT cells, using the values for corresponding concentrations. Inset shows these two curves. Data represent the mean ± SEM from three experiments, each performed in triplicate and on independent cell cultures.
(B) Image of NIR-mbc94 bound to CB2 receptors. Shown is a representative image of NIR-mbc94 (1 μM) bound to CB2 mid DBT cells, gated to the fluorescent signal emitted by NIR-mbc94 bound to untransfected DBT cells image (i.e. non-specific binding) (See Figure S2 for detailed images).
(C and D) Concentration-dependent competition of NIR-mbc94 bound to CB2 receptors. CB2 mid DBT cells were preincubated for 15 min with increasing concentrations of SR144528 (C) or WIN55212-2 (D), and then incubated for 30 min with NIR-mbc94 (200 nM). Fluorescence signal was measured with a Li-Cor Odyssey scanner. Data represent the mean ± SEM from at least three experiments, each performed in triplicate and on independent cell cultures.
See also Table S1.

