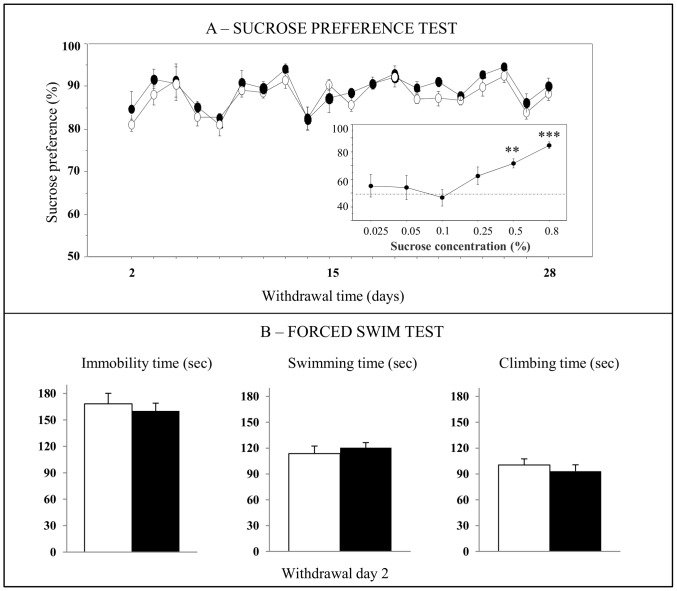
Figure 3. Effects of cocaine withdrawal on depression-related behavior.
Behavior was assessed in the sucrose preference (A, n = 5−6) and forced swim tests (B, n = 8−7) in cocaine-treated rats (black circles or black bars) compared to saline-treated rats (white circles or white bars). (A) Evaluation of the preference for 0.5% sucrose solution during 28 days of withdrawal. The small graph on the bottom right shows the measurement of a preference for the sucrose solution at different concentrations in naive rats. The sucrose consumption data were analyzed by a two-way ANOVA with one between-subject factor (treatment) and one within-subject factor (time). (B) Measurement of different behavioral parameters in the forced swim test performed at 2 days of cocaine withdrawal. Data are expressed as mean + SEM. **p<0.01, ***p<0.001 versus saline-treated rats; Kruskal-Wallis test followed by a Mann-Whitney U test for pairwise comparisons.

