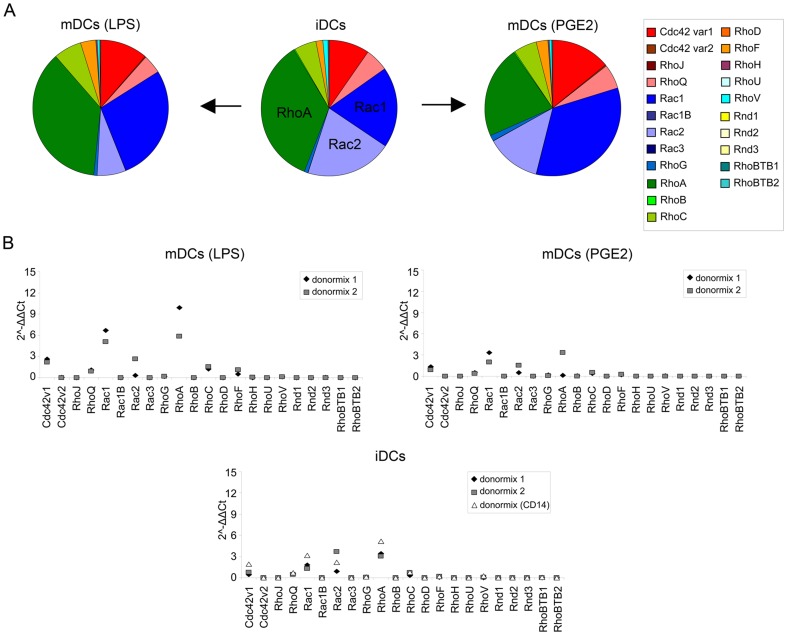
Figure 6. Rho GTPase expression during DC maturation.
(A) Rho GTPase expression in DCs during maturation with LPS or PGE2. The percentage of total Rho GTPase expression is depicted for each DC in a pie chart. Rho GTPase subfamilies and individual Rho GTPases are color coded. iDCs; immature DCs, mDCs (LPS); LPS-matured DCs, mDCs (PGE2); PGE2-matured DCs. (B) The 2−ΔΔCt values of the Rho GTPases in immature and mature DCs. The 2−ΔΔCt values of the individual data points for each cell type are depicted. Donormix 1 and 2 are derived from 9 and 3 donors, resp. Donormix CD14 is derived from the same donors as donormix 2, but monocytes were obtained by elutriation followed by CD14 MACS isolation and differentiated to DCs. iDCs; immature DCs, mDCs (LPS); LPS-matured DCs, mDCs (PGE2); PGE2-matured DCs.

