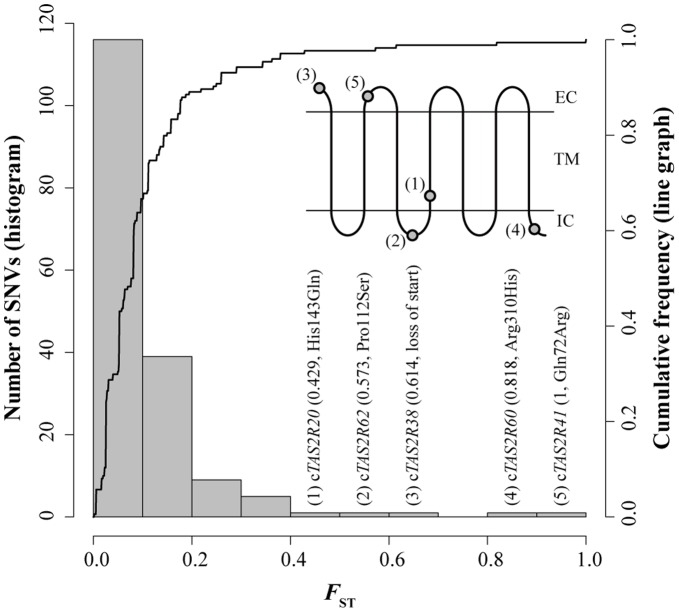
Figure 4. The histogram and cumulative frequency curve of F ST in SNVs in the 28 cTAS2Rs.
This plot was composed from a total of 174 SNVs in western and eastern chimpanzees. Sampled chromosomes carrying whole-gene deletions were omitted from the calculation. Mutation types and amino acid positions of SNVs with higher F ST are shown. Ancestral and derived amino acids were estimated from the haplotype networks. The protein locations are also shown based on Sugawara et al. [15] (EC, extracellular region; TM, transmembrane region; IC, intracellular region).

