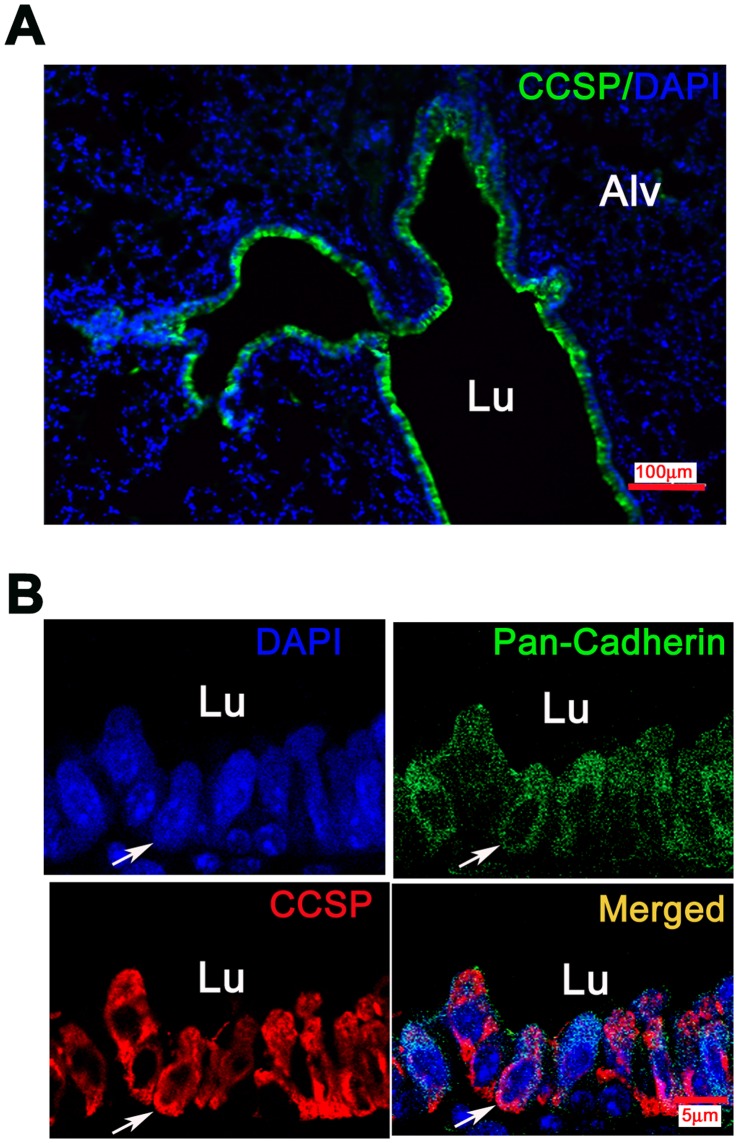
Figure 2. Membranous immunoreactiviy of CCSP in mouse airways.
Photomicrographs of immunofluorescence in mouse lung tissue. A) Low power view of cells lining terminal bronchioles (TBs) that were intensely positive for CCSP (green fluorescence, Bar = 100 µm,Alv = alveoli) B) High power views of co-expression (yellow) of pan-cadherin (green) and CCSP (red) in airway epithelium. Pan-cadherin expression is along the cell membranes, CCSP in the cytoplasm and cell membranes, mostly on outer surface. Bar = 5 µm, Lu = lumen.

