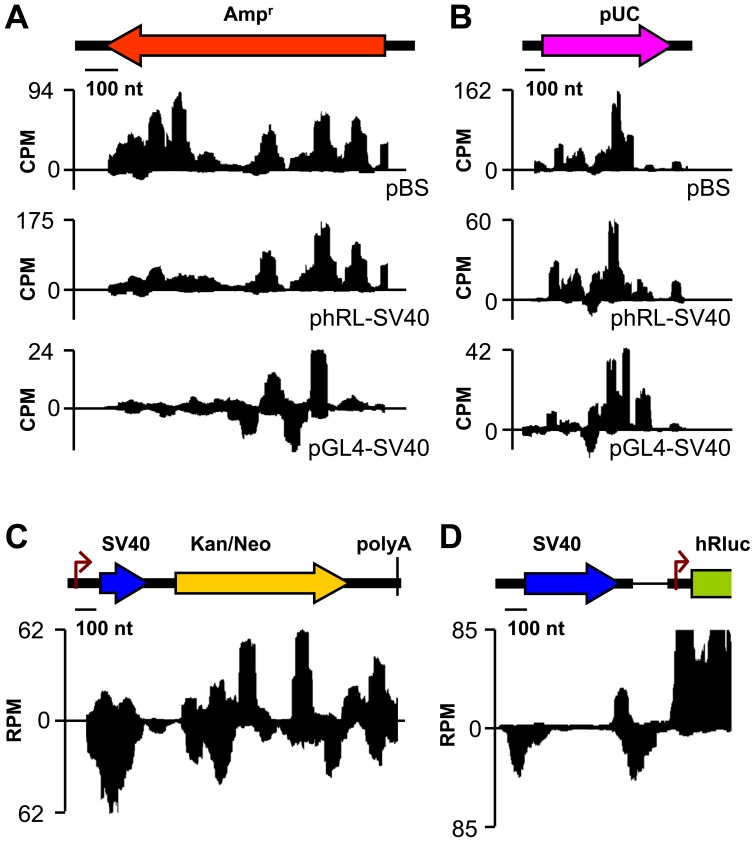
Figure 2. Read densities in specific regions of transfected plasmids.
(A) Ampr, (B) pUC ori. Note the similar pattern of read density for identical sequences in different plasmids and lower read density and altered patterns in pGL4-SV40. (C) Kan/Neo is the main locus where overlapping sense and antisense expression is detected. (D) SV40 promoter and intron-derived RNAs. Y-scale represents normalized read density – aligned reads on a counts per million (CPM) scale.

